Download
1 / 5
50 likes | 188 Vues
Take big data exploration to the next level with combination charts from ZoomCharts. Explore the intricacies of social networks and glean data otherwise incomprehensible with a stunningly vibrant, visual, fully customizable, and completely interactive and intuitive network chart, time chart, and pie chart combination. ZoomCharts’ interactive drill down feature means that you can instantly and easily dive deeper into massive data sets with just a simple click of your mouse or tap of your finger. For example, a click or tap on Julia’s image in the network chart, and a pie chart is generated, showing which social networks Julia uses, and the percentage of the frequency of each. We can see that Julia uses the instant messaging mobile app WhatsApp quite a bit, and the social networking giant Facebook very little. When clicking on a social network, we can see how often Julia posts about particular topics. For example, she is very interested in marriage and television, and much less about weight. Clicking on a particular topic pulls up a time chart that reveals the topics Julia posts about filtered by various time intervals. To go back and explore other social network stats, simply click or tap Julia’s picture. With ZoomCharts, you can work with data charts on any device. Use more traditional devices such as desktops and laptops, or take your data with you to go on any modern mobile device, including touchscreen enabled devices such as tablets and phones. The unmatched high speed performance of ZoomCharts tools means that every click you make results in instantaneous updates and changes, so there’s no waiting around for data to load. See it all in action at https://social.zoomcharts.com/

E N D
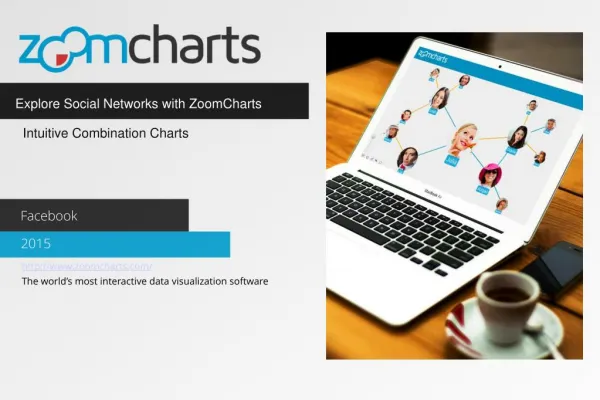
Explore Social Networks with ZoomCharts Intuitive Combination Charts Facebook 2015 http://www.zoomcharts.com/ The world’s most interactive data visualization software
Explore Social Networks with ZoomCharts Intuitive Combination Charts Take big data exploration to the next level with combination charts from ZoomCharts. Explore the intricacies of social networks and glean data otherwise incomprehensible with a stunningly vibrant, visual, fully customizable, and completely interactive and intuitive network chart, time chart, and pie chart combination. ZoomCharts’ interactive drill down feature means that you can instantly and easily dive deeper into massive data sets with just a simple click of your mouse or tap of your finger. For example, a click or tap on Julia’s image in the network chart, and a pie chart is generated, showing which social networks Julia uses, and the percentage of the frequency of each. We can see that Julia uses the instant messaging mobile app WhatsApp quite a bit, and the social networking giant Facebook very little.
Explore Social Networks with ZoomCharts Intuitive Combination Charts • When clicking on a social network, we can see how often Julia posts about particular topics. For example, she is very interested in marriage and television, and much less about weight. • Clicking on a particular topic pulls up a time chart that reveals the topics Julia posts about filtered by various time intervals. • To go back and explore other social network stats, simply click or tap Julia’s picture. • With ZoomCharts, you can work with data charts on any device. Use more traditional devices such as desktops and laptops, or take your data with you to go on any modern mobile device, including touchscreen enabled devices such as tablets and phones. • The unmatched high speed performance of ZoomCharts tools means that every click you make results in instantaneous updates and changes, so there’s no waiting around for data to load. • See it all in action at https://social.zoomcharts.com/
Explore Social Networks with ZoomCharts Intuitive Combination Charts
Check out ZoomCharts products: Network Chart Big network exploration Explore linked data sets. Highlight relevant data with dynamic filters and visual styles. Incremental data loading. Exploration with focus nodes. Time Chart Time navigation and exploration tool Browse activity logs, select time ranges. Multiple data series and value axes. Switch between time units. Pie Chart Amazingly intuitive hierarchical data exploration Get quick overview of your data and drill down when necessary. All in a single easy to use chart. Facet Chart Scrollable bar chart with drill-down Compare values side by side and provide easy access to the long tail. ZoomCharts http://www.zoomcharts.com/ The world’s most interactive data visualization software