How to Get Unmanageable Big Data Under Control
50 likes | 173 Vues
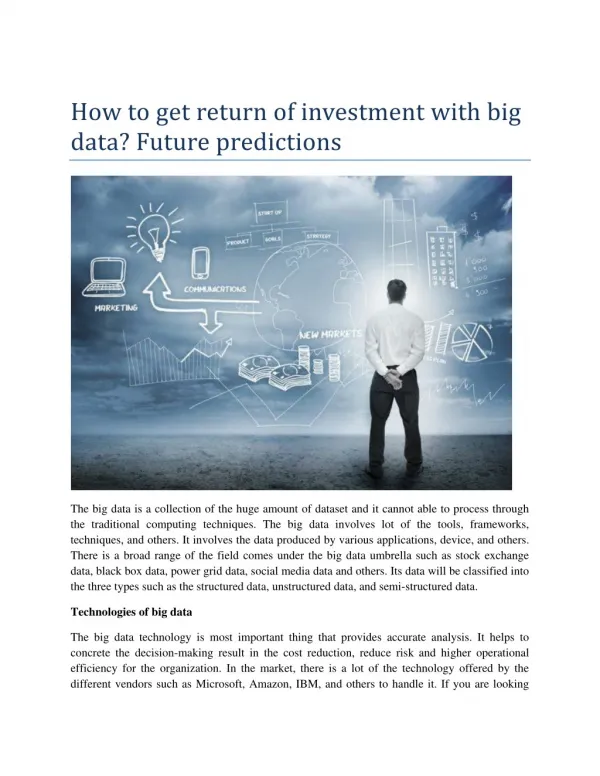
A few short years ago, it would be impossible to predict the precise way in which data has evolved, and just how much data we generate today. To say it has increased in the last few years would be an understatement. There has been exponential growth of new data, now commonly referred to as Big Data. It’s not that big data didn’t exist before; it’s just that it’s much, much bigger now, and it’s being generated at much faster rates, thanks to modern technology. For example, YouTube alone boasts over 1 billion users, 300 hours of video uploaded every minute, and hundreds of millions of hours of video content watched and billions of views generated every single day. And that’s just one website. According to IBM, we generate 2.5 quintillion bytes of data every day. We are practically drowning in new data, at every second, and unless something is being done with it, all this data is rendered essentially useless. Since this is a trend that is not going away any time soon, how are we able to deal with it all? Analyzing the data we generate, particularly online data, is an integral part of how businesses run today. It is important for businesses to understand and analyze information in order to use it to grow their company, and become more efficient with business decisions. Moreover, because much of the data available today is user generated, with everything from emails and clicks, to tweets and Facebook posts, to uploaded photos and videos, it is all being used to gather information on clients and customers, to figure out their interests and habits, market and advertise to them, for the ultimate goal of generating sales from them. This is why data visualization software, such as ZoomCharts charts and graphs, has been invaluable in making it easy to analyze, understand, and present data. ZoomCharts tools are completely interactive, support massive data sets, work on all modern devices including touch screens, and perform at incredibly fast speeds, to ensure that you a

How to Get Unmanageable Big Data Under Control
E N D
Presentation Transcript
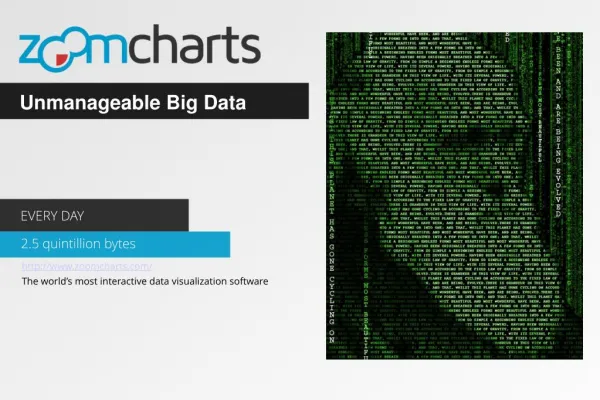
Unmanageable Big Data EVERY DAY 2.5 quintillion bytes http://www.zoomcharts.com/ The world’s most interactive data visualization software
Getting Seemingly Unmanageable Big Data Under Control A few short years ago, it would be impossible to predict the precise way in which data has evolved, and just how much data we generate today. To say it has increased in the last few years would be an understatement. There has been exponential growth of new data, now commonly referred to as Big Data. It’s not that big data didn’t exist before; it’s just that it’s much, much bigger now, and it’s being generated at much faster rates, thanks to modern technology. For example, YouTube alone boasts over 1 billion users, 300 hours of video uploaded every minute, and hundreds of millions of hours of video content watched and billions of views generated every single day. And that’s just one website. According to IBM, we generate 2.5 quintillion bytes of data every day. We are practically drowning in new data, at every second, and unless something is being done with it, all this data is rendered essentially useless. Since this is a trend that is not going away any time soon, how are we able to deal with it all?
Getting Seemingly Unmanageable Big Data Under Control Analyzing the data we generate, particularly online data, is an integral part of how businesses run today. It is important for businesses to understand and analyze information in order to use it to grow their company, and become more efficient with business decisions. Moreover, because much of the data available today is user generated, with everything from emails and clicks, to tweets and Facebook posts, to uploaded photos and videos, it is all being used to gather information on clients and customers, to figure out their interests and habits, market and advertise to them, for the ultimate goal of generating sales from them. This is why data visualization software, such as ZoomCharts charts and graphs, has been invaluable in making it easy to analyze, understand, and present data. ZoomCharts tools are completely interactive, support massive data sets, work on all modern devices including touch screens, and perform at incredibly fast speeds, to ensure that you are in total control of your data, and not the other way around.
Check out ZoomCharts products: Network Chart Big network exploration Explore linked data sets. Highlight relevant data with dynamic filters and visual styles. Incremental data loading. Exploration with focus nodes. Time Chart Time navigation and exploration tool Browse activity logs, select time ranges. Multiple data series and value axes. Switch between time units. Pie Chart Amazingly intuitive hierarchical data exploration Get quick overview of your data and drill down when necessary. All in a single easy to use chart. Facet Chart Scrollable bar chart with drill-down Compare values side by side and provide easy access to the long tail. ZoomCharts http://www.zoomcharts.com/ The world’s most interactive data visualization software