Download
1 / 5
50 likes | 176 Vues
ZoomCharts is offering data visualization tools to support speakers at Columbia-Princeton Probability Day, taking place Friday, March 6, 2015 at the Princeton University Campus’ Lewis Library, Room 120 in Princeton, New Jersey 08544. Check out what you can do with ZoomCharts charts and graphs at http://zoomcharts.com ZoomCharts is the world’s most interactive data visualization software, letting you create fully interactive visual representations of big data sets on modern devices with incredibly fast performance. ZoomCharts tools are being discovered by a growing number of clients in a variety of fields as the best way to analyze and present data. Don’t be among the last to discover the exciting potential that ZoomCharts tools can open up for your data. Columbia-Princeton Probability Day is free to register. Speakers include Davar Khoshnevisan from the University of Utah, Fraydoun Rezakhanlou from UC Berkley, Prasad Tetali from the Georgia Institute of Technology, and Bálint Virág from the University of Toronto. Princeton University is the fourth oldest college in the United States and provides esteemed undergraduate and graduate education in the humanities, social sciences, natural sciences, and engineering, including a wide range of courses such as American studies, architecture, chemistry, classics, computer science, creative writing, dance, economics, engineering, English, environmental studies, finance, French, German, Hebrew, history, Italian, Japanese, journalism, Korean, Latin, linguistics, mathematics, molecular biology, music, neuroscience, philosophy, physics, politics, psychology, religion, Russian, sociology, Spanish, urban studies, and visual arts. ZoomCharts http://www.zoomcharts.com The world’s most interactive data visualization software

E N D
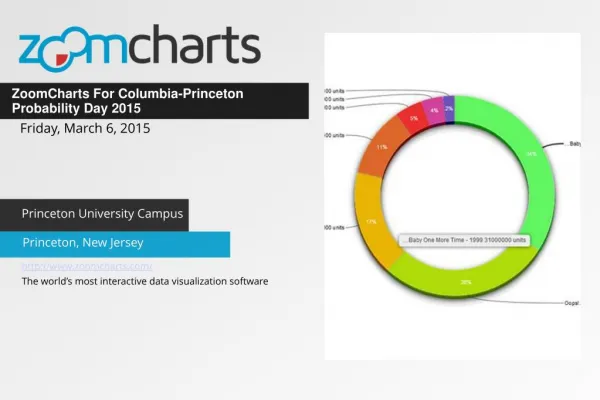
ZoomCharts For Columbia-Princeton • Probability Day 2015 Friday, March 6, 2015 Princeton University Campus Princeton, New Jersey http://www.zoomcharts.com/ The world’s most interactive data visualization software
ZoomCharts For Columbia-Princeton Probability Day 2015 • March 6, 2015 • ZoomCharts is offering data visualization tools to support speakers at Columbia-Princeton Probability Day, taking place at the Princeton University Campus’ Lewis Library, Room 120 in Princeton, New Jersey 08544. • Check out what you can do with ZoomCharts charts and graphs at http://zoomcharts.com • ZoomCharts is the world’s most interactive data visualization software, letting you create fully interactive visual representations of big data sets on modern devices with incredibly fast performance. ZoomCharts tools are being discovered by a growing number of clients in a variety of fields as the best way to analyze and present data. Don’t be among the last to discover the exciting potential that ZoomCharts tools can open up for your data. • Columbia-Princeton Probability Day is free to register. Speakers include Davar Khoshnevisan from the University of Utah, Fraydoun Rezakhanlou from UC Berkley, Prasad Tetali from the Georgia Institute of Technology, and Bálint Virág from the University of Toronto.
ZoomCharts For Columbia-Princeton Probability Day 2015 • March 6, 2015 • Princeton University is the fourth oldest college in the United States and provides esteemed undergraduate and graduate education in the humanities, social sciences, natural sciences, and engineering, including a wide range of courses such as American studies, architecture, chemistry, classics, computer science, creative writing, dance, economics, engineering, English, environmental studies, finance, French, German, Hebrew, history, Italian, Japanese, journalism, Korean, Latin, linguistics, mathematics, molecular biology, music, neuroscience, philosophy, physics, politics, psychology, religion, Russian, sociology, Spanish, urban studies, and visual arts. • Columbia University, the oldest institution of higher learning in the state of New York, offers a variety of areas of study, including anthropology, archeology, astronomy, biochemistry, business, communications, drama and theatre arts, early childhood education, film studies, jazz studies, nursing, political science, Slavic studies, statistics, sustainable development, urban planning, women’s studies, and writing.
ZoomCharts For Columbia-Princeton Probability Day 2015 • March 6, 2015
Check out ZoomCharts products: Network Chart Big network exploration Explore linked data sets. Highlight relevant data with dynamic filters and visual styles. Incremental data loading. Exploration with focus nodes. Time Chart Time navigation and exploration tool Browse activity logs, select time ranges. Multiple data series and value axes. Switch between time units. Pie Chart Amazingly intuitive hierarchical data exploration Get quick overview of your data and drill down when necessary. All in a single easy to use chart. Facet Chart Scrollable bar chart with drill-down Compare values side by side and provide easy access to the long tail. ZoomCharts http://www.zoomcharts.com/ The world’s most interactive data visualization software