Download
1 / 4
40 likes | 174 Vues
ZoomCharts is offering data visualization tools to support speakers at the LeanUX 2015 conference, taking place April 15th through 19th at Brooklyn Bazaar, 165 Banker Street, Brooklyn, New York 11222. Check out what you can do with ZoomCharts charts and graphs at http://zoomcharts.com ZoomCharts is a leading data visualization provider, offering the world’s most interactive data visualization software. All charts and graphs are 100% interactive, support massive data, can be used on all modern devices, and perform at incredibly fast speeds. Be among the growing number of professionals discovering the exciting potential that ZoomCharts has in improving the efficiency of data presentation. LeanUX NYC 2015 is an exciting Lean conference featuring an array of fascinating talks and engaging sessions for those who love designing great products. Get insight from leading Lean experts on how real value for customers is delivered and top line growth is driven through the incorporation of Lean Systems, Agile, Design Thinking, and DevOps. Some of the brightest minds in LeanUX and DevOps will be guest speaking at the event, including Lauren Gilchrist of agile software consulting firm Pivotal Labs; Dave Snowden, founder and chief scientific officer of Cognitive Edge; Dominica DeGrandis of LeanKit; John Shook, chairman and CEO of the Lean Enterprise Institute (LEI) and chairman of the Lean Global Network; Natalie Hollier, VP of UX at Validately, and many, many more. ZoomCharts http://www.zoomcharts.com The world’s most interactive data visualization software

E N D
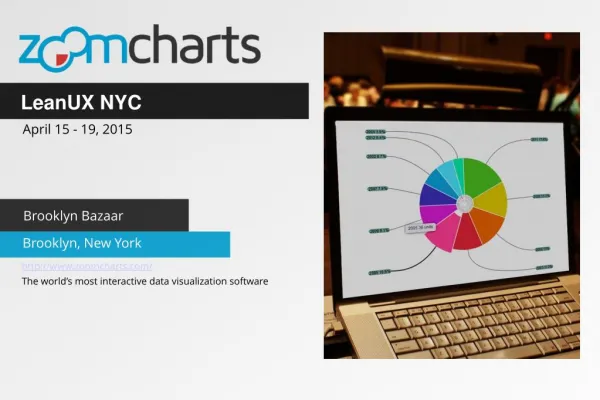
LeanUX NYC April 15 - 19, 2015 Brooklyn Bazaar Brooklyn, New York http://www.zoomcharts.com/ The world’s most interactive data visualization software
LeanUX NYC April 15 - 19, 2015 • ZoomCharts is offering data visualization tools to support speakers at the LeanUX 2015 conference, taking place April 15th through 19th at Brooklyn Bazaar, 165 Banker Street, Brooklyn, New York 11222. • Check out what you can do with ZoomCharts charts and graphs at http://zoomcharts.com • ZoomCharts is a leading data visualization provider, offering the world’s most interactive data visualization software. All charts and graphs are 100% interactive, support massive data, can be used on all modern devices, and perform at incredibly fast speeds. Be among the growing number of professionals discovering the exciting potential that ZoomCharts has in improving the efficiency of data presentation. • LeanUX NYC 2015 is an exciting Lean conference featuring an array of fascinating talks and engaging sessions for those who love designing great products. Get insight from leading Lean experts on how real value for customers is delivered and top line growth is driven through the incorporation of Lean Systems, Agile, Design Thinking, and DevOps. • Some of the brightest minds in LeanUX and DevOps will be guest speaking at the event, including Lauren Gilchrist of agile software consulting firm Pivotal Labs; Dave Snowden, founder and chief scientific officer of Cognitive Edge; Dominica DeGrandis of LeanKit; John Shook, chairman and CEO of the Lean Enterprise Institute (LEI) and chairman of the Lean Global Network; Natalie Hollier, VP of UX at Validately, and many, many more.
LeanUX NYC April 15 - 19, 2015
Check out ZoomCharts products: Network Chart Big network exploration Explore linked data sets. Highlight relevant data with dynamic filters and visual styles. Incremental data loading. Exploration with focus nodes. Time Chart Time navigation and exploration tool Browse activity logs, select time ranges. Multiple data series and value axes. Switch between time units. Pie Chart Amazingly intuitive hierarchical data exploration Get quick overview of your data and drill down when necessary. All in a single easy to use chart. Facet Chart Scrollable bar chart with drill-down Compare values side by side and provide easy access to the long tail. ZoomCharts http://www.zoomcharts.com/ The world’s most interactive data visualization software