ZoomCharts New Software Version 1.4
The ZoomCharts team is proud to unveil the newly updated ZoomCharts software, v1.4. We’ve been listening to your feedback and working hard to make your requests a reality. The updated software includes a handful of significant improvements and impressive features, such as the introduction of a new chart type: the Geo Chart. Version 1.4 upgrade highlights include: • The new Geo Chart, which allows for visualization of map locations • Text caching, which makes for faster Net Chart rendering • A fix for Net Chart label overlapping • New zooming feature for Net Chart labels, an update from the former fixed width labels • New radial layout option for Net Charts • Major updates to documentation • Bug fixes ZoomCharts, the world’s most interactive data visualization software, allows you to create completely interactive visual representations of big data sets on all modern devices, at incredibly fast speeds. ZoomCharts product roster includes: The Pie Chart, which allows for intuitive hierarchical data exploration, giving you a quick overview of your data and, unlike a traditional pie chart, lets you click on slices to drill down further into information when needed. The Facet Chart, a modern bar chart that lets you compare data values side by side in one easy to read representation, and where you can drill down deeper when necessary. The Time Chart, which allows you explore to statistical data within various time ranges, and which supports multiple data series and value axes. The Network Chart, a completely interactive way to explore linked data sets with movable focus nodes, with features such as incremental data loading and exploration of data using dynamic filters. The newly unveiled Geo Chart, an interactive map that lets you explore geographical data, allowing you to plot data over specific locations or regions. Check out our demos that allow you to explore the fully interactive chart experience.

ZoomCharts New Software Version 1.4
E N D
Presentation Transcript
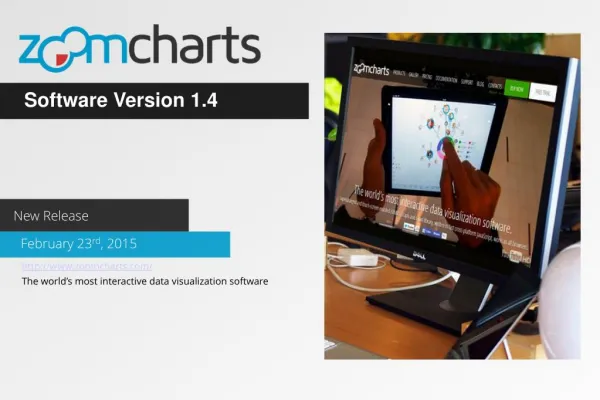
Software Version 1.4 New Release February 23rd, 2015 http://www.zoomcharts.com/ The world’s most interactive data visualization software
ZoomCharts Releases New Software Version 1.4 The ZoomCharts team is proud to unveil the newly updated ZoomCharts software, v1.4. We’ve been listening to your feedback and working hard to make your requests a reality. The updated software includes a handful of significant improvements and impressive features, such as the introduction of a new chart type: the Geo Chart. We’re inviting you to take an early sneak peek to a demo! https://zoomcharts.com/geo-chart-preview/
ZoomCharts Releases New Software Version 1.4 We’ve been listening to your feedback and working hard to make your requests a reality. The updated software includes a handful of significant improvements and impressive features, such as the radial layout for Net Chart. ZoomCharts version 1.4 upgrade highlights include: • A fix for Net Chart label overlapping • New zooming feature for Net Chart labels, an update from the former fixed width labels • Major updates to documentation • Bug fixes • Text caching, which makes for faster Net Chart rendering • New radial layout option for Net Charts:
ZoomCharts Releases New Software Version 1.4 ZoomCharts product roster includes: The Pie Chart, which allows for intuitive hierarchical data exploration, giving you a quick overview of your data and, unlike a traditional pie chart, lets you click on slices to drill down further into information when needed.
ZoomCharts Releases New Software Version 1.4 The Facet Chart, a modern bar chart that lets you compare data values side by side in one easy to read representation, and where you can drill down deeper when necessary.
ZoomCharts Releases New Software Version 1.4 The Time Chart, which allows you explore to statistical data within various time ranges, and which supports multiple data series and value axes.
ZoomCharts Releases New Software Version 1.4 The Network Chart, a completely interactive way to explore linked data sets with movable focus nodes, with features such as incremental data loading and exploration of data using dynamic filters.
ZoomCharts Releases New Software Version 1.4 The newly unveiled Geo Chart, an interactive map that lets you explore geographical data, allowing you to plot data over specific locations or regions. Check out our demos that allow you to explore the fully interactive chart experience. The simple click of a mouse or scroll on a track pad lets you zoom in, zoom out, and drill down further into more data. Become one of the growing number of clients who are discovering the exciting potential that ZoomCharts opens up in analyzing, presenting, and using big data. ZoomCharts’ is supporting data visualization needs in a number of educational fields, including science and mathematics, such as anatomy, biochemistry, ecology, microbiology, nutrition, neuroscience, physiology, zoology, chemical engineering, geochemistry, molecular biology, geology, paleontology, physics, astronomy, algebra, computer science, geometry, logic, and statistics, and the arts such as, music, dance, theatre, film, animation, architecture, applied arts, photography, graphic design, interior design, and mixed media. For more information on ZoomCharts’ full range of capabilities, please visit https://zoomcharts.com/en.
Check out ZoomCharts products: Network Chart Big network exploration Explore linked data sets. Highlight relevant data with dynamic filters and visual styles. Incremental data loading. Exploration with focus nodes. Time Chart Time navigation and exploration tool Browse activity logs, select time ranges. Multiple data series and value axes. Switch between time units. Pie Chart Amazingly intuitive hierarchical data exploration Get quick overview of your data and drill down when necessary. All in a single easy to use chart. Facet Chart Scrollable bar chart with drill-down Compare values side by side and provide easy access to the long tail. ZoomCharts http://www.zoomcharts.com/ The world’s most interactive data visualization software