Understanding Marginal Abatement Cost Curves (MACC) for Global Warming Gases in Agriculture
This overview explores Marginal Abatement Cost Curves (MACC) within agriculture, highlighting their role in assessing the costs associated with reducing greenhouse gas emissions. It differentiates between direct and indirect emissions related to farming practices, providing insights into methodologies used in CAPRI for evaluating emission reductions. The initial results of MACC indicate effective strategies for mitigating global warming, emphasizing the significance of economics in abatement efforts and the importance of policy frameworks like the Kyoto Protocol in shaping agricultural practices.

Understanding Marginal Abatement Cost Curves (MACC) for Global Warming Gases in Agriculture
E N D
Presentation Transcript
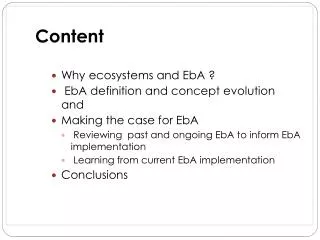
Content • What are marginal abatement cost curves (MACC) ? • Global Warming Gases in CAPRI • Why GW and why CAPRI ? • Methodology • First results
Abatement cost curves • Abatement = reduction of negative externality • Abatement cost curves (ACC)= relation between emission reduction level and total costs • Marginal abatement cost curves (MACC)= relation between emission reduction level and costs for the last abated unit • MACC allow (a) to set up an optimal abatement strategy (b) to calculate regional cost differences under a certain environmental policy (e.g. Kyoto Protocol, nitrate directive, ...)
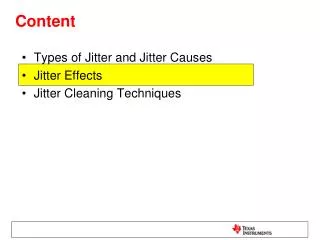
Economics of abatement MAC MACC1 MACC2 Abatement costs eh el Emissions Abatement Two abatement technologies e0
Global Warming Gases in APRI • Distinction between direct and indirect emissions • Direct emission stem directly from agricultural activities(Methane from animals and rice, emissions during fertilizer application or storage, background emission from soils) • Indirect emission stem from other sectorsand are linked to input use in agriculture(fertilizer and energy production) • Both are linked to activities levels (hectares/heads) in the supply model via emission factors • Aggregated to Global Warming Potential via the definition of CO2 impact equivalents
NPK balances • (fertiliser application) • Optimal activity Levels Emissions (passive indicator) Global Warming Gases in APRI • Content of nutrients in harvested material (kg/ton) • Atmospheric deposition at Nuts 0 level (kg/ha) • Available nutrient per crop from atmospheric deposition: available nutrient component for the crop coming from the atmosphere. • Biological fixation: ”self-made fertiliser” • Mineralisation: nitrate from soils available for the crop (kg/ha) • Global warming potential of different gases • Gas output per ton of mineral fertiliser produced (indirectly applied) • CH4 Output of animals kg per animal and year
Why Global Warming? • GW is a global externality: it does not matter where the emission takes place - damage costs are equal among emitters - no regional pricing is therefore necessary - it allows differentiation through abatement costs • Most studies look at a comparison across sectors • Agriculture interesting:subsidies <=> cross compliance <=> low costs for society • MACC contain the necessary information for an effective use of agri-environmental instruments=> new orientation of the CAP (multi-functionality)
Why CAPRI? • CAPRI offers: • - a complete analysis of the agricultural sector=> analyse different strategies inside agriculture • - direct modeling of GWP reductions(ex-post indicator) • - a microeconomic orientation(optimisation problem, shadow values) • - modelling of permit markets(hot issue in the actual international negotiations)
Methodology AB_COST = MAX_Inc(s.t. g>0, GWP unrestricted) - MAX_Inc(s.t. g>0, GWP <Kyoto) where: g restrictions in models (land, set aside,quotas ...) GWP output of GWP from agriculture MAX_Inc maximal agricultural income Kyoto reduction objective