Download
1 / 14
140 likes | 163 Vues
Explore the improved growth momentum in developing countries over the past six months, amid diverse financial and commodity market conditions. While global trade and production show strength, recovery in developing countries varies across regions. Although risks are balanced, concerns loom over oil prices affecting GDP growth. Gain insights on industrial and developing regions' growth rates from 1995-2002, along with short-term interest rates and high-income countries' import volume growth. Understand the impact of oil and non-oil prices on capital market flows and GDP growth forecasts for different world regions.

E N D
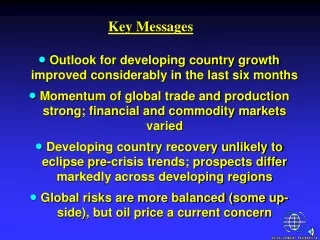
Key Messages • Outlook for developing country growth improved considerably in the last six months • Momentum of global trade and production strong; financial and commodity markets varied • Developing country recovery unlikely to eclipse pre-crisis trends; prospects differ markedly across developing regions • Global risks are more balanced (some up-side), but oil price a current concern
GDP Growth: Industrial and Developing Regions, 1995-2002(percent) Forecast Developing Countries World OECD Source: World Bank baseline, March 2000.
GDP Growth: G-7 and Developing Countries(percent year-over-year) G-7 countries Developing countries Source: DECPG baseline (March 2000) and GEP (November 1999)
Per capita growth distribution by developing country population(percentage of developing country population excluding China, India) 1.6 billion people 140 million people Source: DECPG baseline, March 2000
Convergence of industrial country growth rates in the early 2000s(percent) North America* Euro Area Asia-Pacific** Source: DECPG projections, March 2000. Notes: * North America: United States and Canada; ** Asia-Pacific: Japan, Australia and New Zealand.
U.S. consumer, producer and import prices, 1997-2000(3-month/3-month annualized change in percent ) U.S. import prices Producer prices CPI Source: U.S Bureau of Labor Statistics.
U.S. and Euro-Area short term interest rates, 1997-2000( percent ) U.S. 3-month CD rate Fed Funds Euro-area average 3 month money market Source: Datastream / Euro-stat..
High-income countries’ import volume growth(percent, 3 month/3 month, saar) OECD Asian NIEs Source: Datastream and DECPG staff estimates.
Oil and non-oil prices, 1992-2000(US$/bbl for oil, index 1990=100 for others Source: DECPG, World Bank
Gross capital market flows as a ratio of GDP and spreads on EMBI Basis points percent Capital Market Flows/GDP EMBI Source: Euromoney, IMF, DECPG staff estimates
GDP Growth: East Asia, Latin America and the Transition Economies, 1995-2002(percent) Forecast East Asia Latin America Transition Economies Source: World Bank baseline, March 2000.
GDP Growth: South Asia, MENA and Sub-Saharan Africa, 1995-2002(percent) Forecast South Asia MENA Sub-Saharan Africa Source: World Bank baseline, March 2000.
Global Risks: Four Transitions ... to a ‘soft landing’ in the United States ... from fiscal stimulus to private-demand led growth in Japan ... to healthier financial and corporate sectors in East Asia ... to a medium-term equilibrium price of oil
High Oil price Scenario: GDP Growth for World Regions(difference (-) in growth rates from baseline) Source: DECPG. Simulation of $30/bbl in 2000, $25/bbl in 2001 (Oxford Economics) model. Results validated against simulations prepared by OECD, JP Morgan and other analysts.