Download
1 / 29
290 likes | 447 Vues
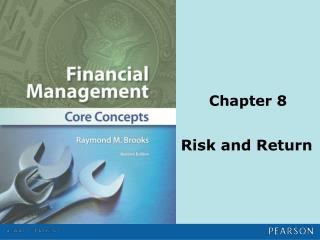
2e created Summer 11. Ch’s 11 & 12: Risk & Return In Capital Markets Purpose of Ch’s 11 & 12: To understand financial risk and learn how to measure the risk associated with securities Learning Objectives : Explain Systematic Risk and Unsystematic Risk

E N D
MGT 326 Ch 11 & 12: Risk & Return in Capital Markets (bdh2e) 2e created Summer 11 Ch’s 11 & 12: Risk & Return In Capital Markets Purpose of Ch’s 11 & 12: To understand financialrisk and learn how to measure the risk associated with securities Learning Objectives: • Explain Systematic Risk and Unsystematic Risk • Describe the Causes of Systematic Risk and Unsystematic Risk • Explain How Standard Deviation Quantifies the Riskiness of a Security or Portfolio • Explain Coefficient of Variation and Use It To Make An Investment Decision • Describe Diversification and How It Reduces the Riskiness of a Portfolio • Describe the Concept of Correlation and How It Affects Diversification • Describe the Capital Asset Pricing Model (CAPM) • Explain What Beta Is • Compute the Required ROR of a Stock Using CAPM • Explain the Difference Between Rqd ROR of a Stock Computed with CAPM and Rqd ROR Derived From the Average of Historical Returns • Explain the Concept of Risk Aversion and Its Effects on Security Valuation and Return • Compute The Expected and Realized Returns of a Portfolio Using CAPM • Compute The Expected and Realized Returns of a Portfolio Using historical Returns
MGT 326 Ch 11 & 12: Risk & Return in Capital Markets (bdh2e) 2e v1.1 created Fall 13 Risk Definitions: • Webster’s: a hazard; a peril; exposure to loss or injury • The chance that an outcome other than that which was expected will occur • The chance that an outcome other than that which was desired (i.e. a negative return, negative future cash flows) will occur. This is financial risk • Uncertainty: the lack of knowledge of what will happen in the future • uncertainty= risk • the greater the uncertainty, the greater the risk Average Annual Return (R): The arithmetic average of an investment’s realized annual stock returns over a certain period (usually 1 or 5 years) R = 1/T(r1 + r2 + ……. + rT) (we learned how to compute r in Ch 7) Example: The realized annual returns For Diamond Jim’s Inc. stock for the last five years were: 8.6782% (2004), 7.4203% (2005), 8.2501% (2006), 6.5925% (2007) and 1.5943% (2008). What is the average annual return for that period? R = 1/5(8.6782% + 7.4203% + 8.2501% + 6.5925% + 1.5943%) = 1/5(32.5354%) = 6.5071% Using the main principle of statistics (past performance is a predictor of future performance) we estimate the expected return from the realized return: R = r (as discussed in Ch 7) Note: we will assume the individual realized annual returns are independent, i.e. the data is “normally distributed”
MGT 326 Ch 11 & 12: Risk & Return in Capital Markets (bdh2e) Quantifying the Risk of a Security – Standard Deviation Two Basic Types of Risk: • Stand-alone Risk : • The risk associated with an investment when it is held by itself or in isolation, and not in combination with other assets • The stand-alone-risk of a particular security can be compared with that of other securities to assess relative riskiness • Portfolio Risk: • The sum total risk of several securities held together in a single “portfolio”. Must account for the correlation of the securities to on another Stand-alone Risk • Big question from statistics: How reliable is the estimate for expected future return? • Standard Deviation answers this question Example: (continued) Compute the standard deviation of the realized annual returns For Diamond Jim’s Inc. stock for the last five years. n S (ri - r)2Pi Variance = s2 = i = 1 n S (ri - r)2Pi Standard Deviation = s = i = 1 Note: since the probability (Pi) was the same for each stock return, it is computed simply as 1/n where n = total number of data points, which is 5 in this case
MGT 326 Ch 11 & 12: Risk & Return in Capital Markets (bdh2e) n S (rt - rAVE)2 Estimated Standard Deviation = S = t = 1 n-1 Stand-alone Risk (continued) Standard Deviation Using Sample Data: • Since it is virtually impossible to find the true s for any population, a sample of values is used: Probability Distribution: the possible values of outcomes associated with the probability of their occurrence Example: Probability distribution for the role of two 6-sided dice Chart Format Graph If there are is a vary large number of discrete random events (data points), the probability distribution looks more like this: Probability Event
MGT 326 Ch 11 & 12: Risk & Return in Capital Markets (bdh2e) 68.26% 95.46% 99.74% -1s +3s -2s -3s +1s +2s rs Stand-alone Risk (continued) Normal Distribution: • Random Sampling: • if n elements are selected from a population in such a way that every set of n in a population has an equal probability of being selected, the n elements are said to be a random sample. (This is the definition of a simple random sample which is the most common technique) • The value of any element is not influenced by the value of any other element; i.e. the data is independent • Normal Distribution: The results of Random Sampling • Historical returns of securities are not truly independent (i.e. the closing price of a stock on any particular day may be influenced by the closing stock price on previous days) but they are close enough to being so that we usually treat them as being normally distributed • This means that the statistical methods for analyzing security returns is relatively simple Empirical Rule: For normally distributed data
MGT 326 Ch 11 & 12: Risk & Return in Capital Markets (bdh2e) Stand-alone Risk (continued) How Standard Deviation Quantifies Risk: • Standard deviation describes the degree of variation or the “range” of a probability distribution • The higher the s, the greater the range of possible outcomes, the greater the uncertainty concerning the next possible outcome, thus greater risk • A “tighter” or “narrower” probability distribution (as compared to other probability distributions) means a lower relative s, which means less uncertainty concerning the next possible outcome • The smaller the s, the more reliable the estimated expected return Example: The probability distributions for two different stocks are shown below. Both stocks have an expected return (rs) of 15%. Which stock is riskier? Probability Density 0.5 - Diamond Jim’s Inc. Note: the area under each curve equals 1.00 (i.e. 100% probability) Jihad Jim’s Military Surplus LLC Rate of Return (%) 15% 0% Expected Rate of Return (rs) Answer: Jihad Jim’s is riskier • Jihad Jim’s standard deviation is clearly much greater than that of Diamond Jim’s • The possible range of values for next years stock return for Jihad Jim’s is much greater than that for Diamond Jim’s • Jihad Jim’s expected stock return is much more uncertain • The estimate for expected return for Jihad Jim’s is much less reliable • Jihad Jim’s stock is much more risky than Diamond Jim’s stock
MGT 326 Ch 11 & 12: Risk & Return in Capital Markets (bdh2e) • Stand-alone Risk (continued) • Most Common Way to Determine Rs, rs and s 1) Find the monthly closing price of a stock for the last 61 months 2) Compute the ROR for each month (New-Old)/Old 3) Compute the average monthly ROR (use Excel function: AVERAGE) 4) Convert the monthly average to an annual average. This is the average annual return Rs for the five year period 5) As stated before: rs = Rs≈ rs • 5) Use the Excel function: STDEV to find s of monthly returns • 6) Convert this to an annualized s, multiply by SQRT(12)
MGT 326 Ch 11 & 12: Risk & Return in Capital Markets (bdh2e) R = 49.0165% per annum ≈ r s = 39.043% Excel Example: Apple Inc. (AAPL) = (B4-B3)/B3 = 11.2596*SQRT(12) = STDEV(C4:C63) = 4.0847%*12 or D3*12 = AVERAGE(C4:C63) Note: monthly adjusted closing prices from Yahoo.com
MGT 326 Ch 11 & 12: Risk & Return in Capital Markets (bdh2e) Risk Aversion: (Not covered in your text book) • Concept: Given two securities with equal expected returns but different degrees of risk, the rational investor would choose the one with lower risk • Most investors tend to choose less risky investments and accept commensurately lower returns • Valuation Implications: • if two securities offer the same ROR, the riskier one is priced lower if the seller of that security wants anybody to buy it (the less riskier one is priced higher) • if two securities are priced the same, the riskier one must offer higher expected returns if the seller of that security wants anybody to buy it • the difference between these expected returns is a risk premium • market forces (risk aversion influencing supply & demand) force the above to occur How much higher does the ROR have to be or how much lower does the price have to be? Answer: • ref. bonds (Ch 6): Consider 2 bonds with the same par value, maturity & coupon rate but different rd (one bond is AAA rated with rd of 4%, the other is B rated with rd of 6%). What’s the difference in value between two ? Example: FV=$1,000, rCPN = 5%, annual payment, 5-yr maturity • AAA Bond: N=5, I/YR=4%, PMT=50, FV=1000; PV= $1044.52 • B Bond: N=5, I/YR=6%, PMT=50, FV=1000; PV= $957.88 • ref. stocks (Ch 7): how does P0 change with different required ROR’s?
MGT 326 Ch 11 & 12: Risk & Return in Capital Markets (bdh2e) Probability Walmart Target 6.5% 9.3% Expected Return (Average Return) ~ Coefficient of Variation (CV) (Not covered in your text book) • A way to quantify the relationship between risk and return • Given two securities with equal expected returns but different degrees of risk, the rational investor would choose the one with lower risk • The CV….. • is defined as: CV = s / r S / r ; smaller is better • shows the risk per unit of return; • it provides a standardized measure of risk; the basis of comparison (per unit return) is the same • provides a more meaningful basis for comparison when the expected returns of two alternatives are not the same • Using CV to measure risk/return characteristics of two stocks is like using miles per gallon (MPG) to measure fuel efficiency of two cars Example: Driver A travels 450 mi. in his ‘95 Geo Metro and consumes 12 gal. of gas. Driver B travels 890 mi. in his ’71 LS5 (454+cu) Corvette, stopping 3 times to fuel up and consumes 65 gal. of gas. What is the relative fuel efficiency of the two cars? Geo: 450 mi./12 gal. = 37.5 mi. per gal ‘Vette: 890 mi./65 gal. = 13.7 mi. per gal. • The standardized measure is one gallon of gas Example: An investor wants to compare the risk/reward characteristics of two retail merchandising firms: Walmart and Target.
MGT 326 Ch 11 & 12: Risk & Return in Capital Markets (bdh2e) ~ Example (continued) The average monthly returns for two firms over the last five years are: Walmart, 6.5%; Target, 9.3%. Based on the same data, the estimated standard of deviations (S) for the two firms are: Walmart, 10.3%; Target, 21.6%. Compute the coefficient of variation for the two firms. Which has the best risk/return characterisitcs? CVWalmart = s / r S / r = 10.3% / 6.5% = 1.58 CVTarget = 21.6% / 9.3% = 2.32 • The standardized measure is one unit of risk • Caution: CV doesn’t work if the expected returns are significantly different Example: Consider the probability distributions of two the two firms shown below. CVKay-Mart is 1.93 while CVDiamond Jim’s is 3.76. CV analysis indicates that Kay-Mart has superior risk/return characteristics. However it would be more advantageous to invest in Diamond Jim’s. Why? Probability Kay-Mart Diamond Jim’s Inc. 3.5% 14.3% Expected Return (Average Return)
MGT 326 Ch 11 & 12: Risk & Return in Capital Markets (bdh2e) Portfolio Investing • Investing in a portfolio of securities is less risky than investing in any single security. Why? Answer: the risks of the individual securities comprising the portfolio are averaged. How? Answer: • Diversification: • the tendency for price movements of individual securities to counteract each other • This means that the price changes of the portfolio are usually less than the price changes of the individual securities • thus the price/return volatility (s) of the portfolio is less the price/return volatility (s) of the individual securities • Thus the risk of the portfolio is less than that of the securities comprising the portfolio • As more securities are added to a portfolio, the overall risk (s) of the portfolio decreases • The securities should not be very correlated • Securities (when combined in a portfolio) from companies in the same industry are (usually) highly positively correlated thus not much diversification effect
MGT 326 Ch 11 & 12: Risk & Return in Capital Markets (bdh2e) created Summer 09 Portfolio Returns • Portfolio Expected Returns (E[Rp] or rp): The weighted average of the expected returns of the individual securities held in a portfolio E[Rp] = w1E[R1] + w2E[R2] + …… wnE[Rn] rp = w1r1 + w2r2 + …… wnrn OR Example: A portfolio consists of stocks from four companies and the expected returns (rs) for each stock are given. Find rp. 400 x $43.67 $17,468 / $90,849.50 0.1923 x 5.65%
MGT 326 Ch 11 & 12: Risk & Return in Capital Markets (bdh2e) Portfolio Returns (continued) Portfolio Realized Rate of Return (Rp): • The return that a portfolio actually earned • For a portfolio, realized ROR (Rp) is the weighted average of the realized RORs of the individual securities held in a portfolio Rp = w1R1 + w2R2 + …… wnRn Example(continued): The portfolio is held for one year and the end of period price for each stock is indicated below. Find rp and the value of the portfolio at the end of the holding period. ($45.67 - $43.67) / $43.67 (New – Old) / Old Note: 1. The weights have changed 2. This example does not include dividend yield (Ch 9) Another Way to Find rp: • Premise of statistics: past performance is an indicator of future performance • rp for an upcoming period = rp for the previous period
MGT 326 Ch 11 & 12: Risk & Return in Capital Markets (bdh2e) Diversification of a Portfolio Correlation: • the behavioral relationship between two or more variables (stocks in a portfolio) • a measure of the degree to which returns share common risk. • it is calculated as the covariance of returns divided by the standard deviation of each return • Various conditions (i.e. the economy, security market forces & movements, financial performance of individual companies, political developments, etc.) will cause the securities held in a portfolio to change in value • The direction and magnitude of how the value of securities held in a portfolio change with respect to each other can be described by correlation • Positive Correlation: When external conditions cause the securities in a portfolio to change value in the same direction (i.e. they all increase in value or they all decrease in value) • Negative Correlation: When external conditions cause the securities in a portfolio to change value in the opposite directions (one security increases in value, another decreases in value) • No Correlation: The direction and magnitude of changes in value of one security are totally unrelated to those of another security
MGT 326 Ch 11 & 12: Risk & Return in Capital Markets (bdh2e) • Diversification of a Portfolio (continued) • Correlation Coefficient (r): • A measure of the degree of correlation between variables (stock securities, in this chapter) • Perfectly negative correlation; r = -1 • Perfectly positive correlation; r = 1 • No correlation; r = 0 • How is correlation between two stocks determined? • The returns from stocks that are highly correlated tend to move together • they are affected by the same economic factors • stocks in the same industry tend to be highly correlated • they are exposed to similar risks • Academics have shown (after doing a whole lot of statistics) that: • The returns for two randomly selected stocks have an r of about 0.6 • For most pairs of stock, r lies between 0.5 and 0.7 • This means that that most stocks are partially positively correlated and partially negatively correlated • This means that combining two stocks (in a portfolio) can reduce overall risk • Portfolio Standard Deviation: • Unlike expected and realized portfolio returns, portfolio s is not a weighted average of individual security s’s • Portfolio risk is usually smaller than the weighted average of individual security s’s • Portfolio risk is entirely dependent on the correlation among the securities held in the portfolio • Read pp 370-374 for a discussion on how to compute portfolio s
MGT 326 Ch 11 & 12: Risk & Return in Capital Markets (bdh2e) Stock L Stock M Portfolio LM 25 25 15 15 Rate of Return (%) 0 97 97 97 97 98 98 98 98 99 99 99 99 2000 2000 2000 2000 0 -10 -10 Correlation & Diversification Effect on Portfolio Risk Perfectly Positively Correlated Stocks (Note: sp = sM = sM’) Stock G Portfolio GH Stock H 25 25 15 15 Rate of Return (%) Rate of Return (%) 0 0 -10 -10 Perfectly Negatively Correlated Stocks (Note: sp = 0) Rate of Return (%)
MGT 326 Ch 11 & 12: Risk & Return in Capital Markets (bdh2e) Correlation & Diversification Effect on Portfolio Risk Partially Correlated Stocks (Note: sp < sW & sY) Stock A Portfolio Stock C Stock B Stock D Diversification is important, especially for corporate investors; they are very concerned about the liquidity of their investments
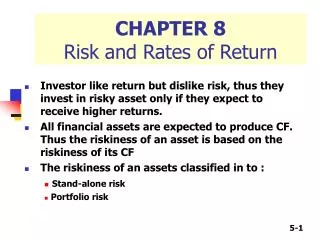
MGT 326 Ch 11 & 12: Risk & Return in Capital Markets (bdh2e) Systematic Risk versus Unsystematic Risk • The total risk of any security is due to a combination of Systematic Risk and Unsystematic Risk • Systematic Risk (Market Risk, Undiversifiable Risk or Beta Risk) • this is the volatility of the an entire securities market (NYSE, NASDAQ, bond markets, etc) • this volatility is due to changes in macro-economic, broad micro-economic conditions and geo-political events • it applies to most of the firm’s that trade in a specific market (but not necessarily to the same extent) • Because most stocks are somewhat partially correlated, most stocks do well when the economy is good and not so well when the economy is not so good • there is no feasible way to eliminate the Systematic Risk of a particular market • Unsystematic Risk (Diversifiable Risk, Firm Specific-Risk or Unique Risk) • it is reflected in the volatility of the securities (stocks & bonds) of a specific firm • it is that part of a security’s risk associated with factors generated by events, or behaviors, specific to the firm or the firm’s industry • it is the result of the firm’s inherent management decisions, legal problems, product or service obsolescence, the firm’s market viability, etc. and that of their competition • there is a way to reduce diversifiable (firm-specific) risk: • build a portfolio of securities from different industries or industry sectors (stocks that are not well correlated with each other) • this will produce the diversification effect
MGT 326 Ch 11 & 12: Risk & Return in Capital Markets (bdh2e) created Summer 09 Systematic Risk versus Unsystematic Risk (continued) stotal Portfolio Risk Unsystematic (Firm-Specific, Diversifiable) Risk Minimum Attainable Risk in a Portfolio of Average Stocks smarket Volatility (Risk) Total Portfolio Risk Systematic (Market or Beta) Risk) 1 10 20 30 40 1500+ Number of Stocks in the Portfolio How Many Securities is Enough? • 18 securities provide about 90% complete diversification • 32 securities provide about 95% complete diversification • The law of diminishing returns is in effect here • p falls very slowly after about 40 stocks are included in the portfolio. • By forming well-diversified portfolios, investors can eliminate about half the riskiness of owning a single stock • Diversification does not reduce Firm-Specific Risk; it reduces the effects of Firm-Specific Risk on a portfolio
MGT 326 Ch 11 & 12: Risk & Return in Capital Markets (bdh2e) Measuring Systematic Risk • Portfolio standard deviation measures total risk • The book says only systematic risk is related to required return (i.e. systematic risk is all that matters since unsystematic risk can be diversified away) • Prof. Jim has strong reservations concerning this statement • it is true only if the stocks are truly randomly chosen and there are at least 40 stocks (thus the portfolio is well diversified) • it is not true if stocks in the portfolio are not randomly chosen • If systematic risk is the only one that matters, then we need a way to quantify just the systematic risk • Market Portfolio & Market (Systematic) Risk: • A market portfolio is a portfolio of all risky investments, held in proportion to their value • A market portfolio is a portfolio of all the stock in a particular market (i.e. NYSE, NASDAQ, AMEX • the standard deviation of the market portfolio quantifies the volatility of the entire system; it is the amount of systematic risk that particular market has Capital Asset Pricing Model (CAPM): • A theory that quantifies the market risk of an stock by comparing the behavior of that stock to the behavior of the market portfolio • This behavioral relationship is expressed by a variable called Beta (b) • Definition: b is a measure of the extent to which the returns of a particular security move with respect to the returns of the securities market as a whole • bmeasure a stock’s sensitivity to the market portfolio (the rest of the market) • b quantifies a stock’s market risk • b tells us how risky a particular stock is compared to a market portfolio (the rest of the market)
MGT 326 Ch 11 & 12: Risk & Return in Capital Markets (bdh2e) Individual Stock Return 40 30 20 10 -10 40 -30 30 -40 20 -20 10 Market Portfolio Return -10 -20 -30 -40 Measuring Systematic Risk Capital Asset Pricing Model (CAPM): (continued) • the market portfolio has b = 1 (by definition) • if a stock has b = 1, it’s returns will tend to move in the same direction and magnitude as the market portfolio; the stock is just as risky as the market • if a stock has b = 2, it’s returns will tend to move in the same direction but twice the magnitude as the market portfolio; the stock is twice as risky as the market • if a stock has b = -1, it’s returns will tend to move the same magnitude but in the opposite direction as the market portfolio • if a stock has b = 0, the direction and magnitude of it’s returns movements will be totally unrelated to the market portfolio How to calculate b • plot the stock’s historical returns against historical returns of the market portfolio • use regression (line fit techniques) to form a line • b is the slope of the fitted line • Analysts typically use five years’ of monthly returns to establish the regression line. Some use 52 weeks of weekly returns
MGT 326 Ch 11 & 12: Risk & Return in Capital Markets (bdh2e) Measuring Systematic Risk Capital Asset Pricing Model (CAPM): (continued) Individual Stock Return 40 b = 2 b = 1 30 b = 0.5 20 450 10 -10 40 -30 30 -40 20 -20 10 Market Portfolio Return -10 -20 -30 b = -1 -40 • You don’t have to calculate b’s on your own; you can find them online (yahoo/finance; Hoover’s, WSJ, etc.) • Very few stocks have negative b’s • b quantifies a firm’s Market Risk; it doesn’t say anything about Firm-Specific Risk • CAPM assumes the stock in question is part of a well diversified portfolio thus the Firm-Specific Risk of an individual stock should have a negligible effect on portfolio returns
MGT 326 Ch 11 & 12: Risk & Return in Capital Markets (bdh2e) Measuring Systematic Risk Capital Asset Pricing Model (CAPM): (continued) More on Risk versus Return: • Recall the concept of risk premiums (DRP, LP, MRP) • 30-day T-bills (which are considered riskless) compensate lenders only for opportunity costs and inflation (i.e. rT-bill = r* + IP = rRF) • Individual stocks as well as entire stock markets must compensate investors at least for opportunity costs, inflation and risk or nobody would invest in them (r = r* + IP + RP from Ch 5) • Market Risk Premium: • We identified DRP, LP and MRP which we discussed in the context of lending money • the same concepts behind the above premiums apply to stocks • but there are an unbelievably long and complex list of additional factors that also apply to stocks which can’t easily be broken down into individual components • therefore we lump them all together and just refer to the “risk premium” (RP) for individual stocks and stock markets as a whole • Any securities market has a required rate of return (rM) • rM for any market is simply the current average return for that market (this assumes that market forces and risk aversion have already been at work to “force” the required ROR to equal average return) • The rM for any market is composed, in part, of some sort of compensation for opportunity cost and inflation. This is the nominal risk-free rate (rRF) (sound familiar?) The rest must be compensation for risk. • Thus rM = rRF + Market Risk Premium(RPm) • Market Risk Premium: RPm = (rM - rRF) (by definition)
MGT 326 Ch 11 & 12: Risk & Return in Capital Markets (bdh2e) Measuring Systematic Risk Capital Asset Pricing Model (CAPM): (continued) Example: If the NASDAQ has had an average ROR of 6.5% over the last five years and 30-day T-bills have had an average return of 1.9% for the last five years, what is the NASDAQ market risk premium? Market Risk Premium: RPm = (rM - rRF) = 6.5% - 1.9% = 4.6% • Individual Stock Risk Premium: RPs = (rM - rRF)bs = RPmbs • The risk of an individual stock as portrayed by its b is incorporated in computing that stock’s risk premium Finding Required ROR (rs) for an Individual Stock: • It should be apparent by now that rs for a stock should be related to the riskiness of the firm that issues that stock. Thus: rs = rRF + (rM - rRF)bs = rRF + RPmbs • The above formula is call the “Capital Asset Pricing Model” (CAPM) formula • Another way to look at the CAPM formula: Mkt Risk Premium Quantity of Risk (Cost of Risk) rs = rRF + (rM - rRF)bs Compensation for Opp. Cost & Inflation Stock Risk Premium
MGT 326 Ch 11 & 12: Risk & Return in Capital Markets (bdh2e) Measuring Systematic Risk Finding Required ROR (rs) for an Individual Stock Example: Jamaica Jim’s Caribbean Pirate Adventures Inc. stock trades on the NASDAQ and has a b of 1.96. If the NASDAQ has had an average ROR of 5.3% for the last 5 years and 30-day T-bills are currently returning 1.4%, what is the required ROR for this stock? rs = rRF + (rM - rRF)bs = 1.4% + (5.3% - 1.4%)1.96 = 9.04% Required ROR (rs) vs Expected ROR ( rs) • As discussed in Ch 9, rs for a rational investor is at least equal to rs • Thus rs> rs; for all practical purposes, rs = rs Important Point Regarding Market Risk & Firm Specific Risk: rs produced by the CAPM formula and rs produced using statistical averaging of historical returns (as discussed in Ch 10) won’t be equal to each other. Why? Answer: • The statistical rs incorporates both market risk and firm specific risk • The CAPM rs incorporates market risk only • b is a measure of market risk only • CAPM assumes all stocks under consideration will be part of a well diversified portfolio, thus firm specific risk is negligible and can be ignored
MGT 326 Ch 11 & 12: Risk & Return in Capital Markets (bdh2e) Measuring Systematic Risk Beta of a Portfolio: • bp is the weighted average of the b’s of the stocks that comprise the portfolio bp = w1b1 + w2b2 + w3b3 + …... wnbn Example: A portfolio is comprised of the stocks indicated below. Find the portfolio’s b. Required ROR for a Portfolio (rp) using bp: This is the main advantage of the CAPM rp = rRF + (rM - rRF)bp • rp for a rational investor is at least equal to rp • Thus rp> rp; for all practical purposes, rp = rp • rp produced using CAPM (as shown above) and rp (as discussed earlier) should be fairly close. Why? Answer: Both methods incorporate diversification and thus minimize firm specific risk. If the portfolio is well diversified, all that’s left is market risk and it’s pretty much equal regardless of which method you use to measure it
MGT 326 Ch 11 & 12: Risk & Return in Capital Markets (bdh2e) Security Market Line (SML): • The CAPM equation is also the algebraic equation for a line • rRF is the y-intercept • The slope of this line is rM - rRF (i.e. RPM) • This slope will change only when rM or rRF change • bj is the x-axis value • This line can be used to find k for any security, if you know b for that security Required ROR (%) rhigh = 22 rM = rA = 14 rRF = 6 Relatively Risky Stock’s Risk Premium: 16% Market (Average Stock) Risk Premium: 8% rLOW = 10 Safe Stock Risk Premium: 4% Risk-Free Rate: 6% 0 0.5 1.0 1.5 2.0 Risk, (bj)
MGT 326 Ch 11 & 12: Risk & Return in Capital Markets (bdh2e) What’s the point of all this stuff in Chapters 10 & 11? Answer: • Security value & ROR are influenced by risk • If you know rs or rp…. • And if you know rs or rp…… • You should be able to determine if your investments are performing as well as they should with respect to their theoretical riskiness Key Point: b is a tool to assess risk/reward potential of a security, it is not (by itself) a predictor of how the security will perform in the future