Data Mining and Machine Learning via Support Vector Machines
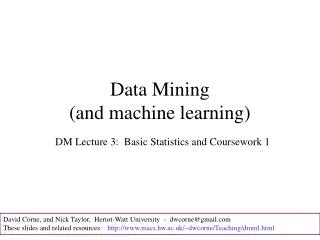
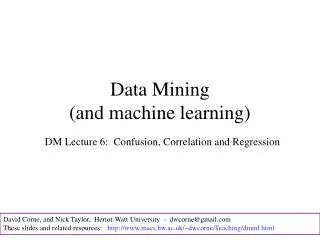
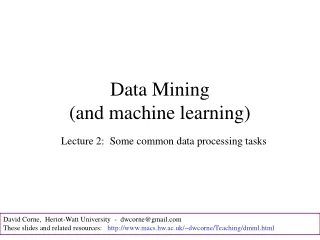
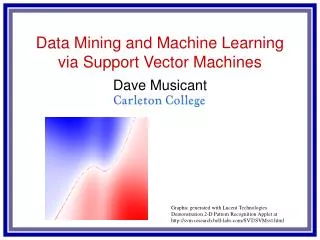
Data Mining and Machine Learning via Support Vector Machines. Dave Musicant. Graphic generated with Lucent Technologies Demonstration 2-D Pattern Recognition Applet at http://svm.research.bell-labs.com/SVT/SVMsvt.html. Outline. The Supervised Learning Classification Problem

Data Mining and Machine Learning via Support Vector Machines
E N D
Presentation Transcript
Data Mining and Machine Learningvia Support Vector Machines Dave Musicant Graphic generated with Lucent TechnologiesDemonstration 2-D Pattern Recognition Applet athttp://svm.research.bell-labs.com/SVT/SVMsvt.html
Outline • The Supervised Learning Classification Problem • The Support Vector Machine for Classification (linear approaches) • Nonlinear SVM approaches • Active learning techniques for SVMs • Iterative algorithms for solving SVMs • SVM Regression • Wrapup
Basic Definitions • Data Mining • “non trivial process of identifying valid, novel, potentially useful, and ultimately understandable patterns in data.”-- Usama Fayyad • Utilizes techniques from machine learning, databases, and statistics • Machine Learning • “concerned with the question of how to construct computer programs that automatically improve with experience."-- Tom Mitchell • Fits under Artificial Intelligence umbrella
Supervised Learning Classification • Example: Cancer diagnosis Training Set • Use this training set to learn how to classify patients where diagnosis is not known: Test Set Input Data Classification • The input data is often easily obtained, whereas the classification is not.
Classification Problem • Goal: Use training set + some learning method to produce a predictive model. • Use this predictive model to classify new data. • Sample applications:
Application: Breast Cancer Diagnosis Research by Mangasarian,Street, Wolberg
Breast Cancer Diagnosis Separation Research by Mangasarian,Street, Wolberg
Application: Document Classification • The Federalist Papers • Written in 1787-1788 by Alexander Hamilton, John Jay, and James Madison to persuade residents of the State of New York to ratify the U.S. Constitution • All written under the pseudonym “Publius” • Who wrote which of them? • Hamilton wrote 56 papers • Madison wrote 50 papers • 12 disputed papers, generally understood to be written by Hamilton or Madison, but not known which Research by Bosch, Smith
Federalist Papers Classification Graphic by Fung Research by Bosch, Smith
Application: Face Detection • Training data is a collection of Faces and NonFaces • Rotation and Mirroring added in to provide robustness Image obtained from work by Osuna, Freund, and Girosi athttp://www.ai.mit.edu/projects/cbcl/res-area/object-detection/face-detection.html
Face Detection Results Image obtained from "Support Vector Machines: Training and Applications" by Osuna, Freund, and Girosi.
Face Detection Results Image obtained from work by Osuna, Freund, and Girosi athttp://www.ai.mit.edu/projects/cbcl/res-area/object-detection/face-detection.html
Simple Linear Perceptron Class -1 Class 1 • Goal: Find the best line (or hyperplane) to separate the training data. How to formalize? • In two dimensions, equation of the line is given by: • Better notation for n dimensions: treat each data point and the coefficients as vectors. Then equation is given by:
Simple Linear Perceptron (cont.) • The Simple Linear Perceptron is a classifier as shown in the picture • Points that fall on the right are classified as “1” • Points that fall on the left are classified as “-1” • Therefore: using the training set, find a hyperplane (line) so that • This is a good starting point. But we can do better! Class -1 Class 1
Finding the Best Plane • Not all planes are equal. Which of the two following planes shown is better? • Both planes accurately classify the training set. • The solid green plane is the better choice, since it is more likely to do well on future test data. • The solid green plane is further away from the data.
Separating the planes • Construct the bounding planes: • Draw two parallel planes to the classification plane. • Push them as far apart as possible, until they hit data points. • The classification plane with bounding planes furthest apart is the best one. Class -1 Class 1
Recap: Finding the Best Plane • Details • All points in class 1 should be to theright of bounding plane 1. • All points in class -1 should be to theleft of bounding plane -1. • Pick yi to be +1 or -1 depending on the classification. Then the above two inequalities can be written as one: • The distance between bounding planes should be maximized. • The distance between bounding planes is given by: Class -1 Class 1
The Optimization Problem • The previous slide can be rewritten as: • This is a mathematical program. • Optimization problem subject to constraints • More specifically, this is a quadratic program • There are high powered software tools for solving this kind of problem (both commercial and academic) • These general purpose tools are slow for this particular problem
error Data Which is Not Linearly Separable • What if a separating plane does not exist? • Find the plane that maximizes the margin and minimizes the errors on the training points. • Take original inequality and add a slack variable to measure error:
The Support Vector Machine • Push the planes apart and minimize the error at the same time: • C is a positive number that is chosen to balance these two goals. • This problem is called a Support Vector Machine, or SVM.
Terminology • Those points that touch the bounding plane, or lie on the wrong side, are called support vectors. • If all the data points except the support vectors were removed, the solution would turn out the same. • The SVM is mathematically equivalent to force and torque equilibrium (hence the name support vectors).
Example from Carleton College • 1850 students • 4 year undergraduate liberal arts college • Ranked 5th in the nation by US News and World Report • 15-20 computer science majors per year • All research assistants are full-time undergraduates
Student Research Example • Goal: automatically generate “frequently asked questions” list from discussion groups • Subgoal #1: Given a corpus of discussion group postings, identify those messages that contain questions • Recruit student volunteers to identify questions • Learn classification • Work by students Sarah Allen, Janet Campbell, Ester Gubbrud, Rachel Kirby, Lillie Kittredge
Building A Training Set • Which sentences are questions in the following text? From: oehler@yar.cs.wisc.edu (Wonko the Sane) I was recently talking to a possible employer ( mine! :-) ) and he made a reference to a 48-bit graphics computer/image processing system. I seem to remember it being called IMAGE or something akin to that. Anyway, he claimed it had 48-bit color + a 12-bit alpha channel. That's 60 bits of info--what could that possibly be for? Specifically the 48-bit color? That's 280 trillion colors, many more than the human eye can resolve. Is this an anti-aliasing thing? Or is this just some magic number to make it work better with a certain processor.
Representing the training set • Each document is a point • Each potential word is a column (bag of words) • Other pre-processing tricks • Remove punctuation • Remove "stop words" such as "is", "a", etc. • Use stemming to remove "ing" and "ed", etc. from similar words
Results • If you just guess brain-dead: "every message contains a question", get 55% right • If you use a Support Vector Machine, get 66.5% of them right • What words do you think were strong indicators of questions? • anyone, does, any, what, thanks, how, help, know, there, do, question • What words do you think were strong contra-indicators of questions? • re, sale, m, references, not, your
Beyond lines • Some datasets may not be best separated by a plane. • SVMs can be extended to nonlinear surfaces also. Generated with Lucent TechnologiesDemonstration 2-D Pattern Recognition Applet athttp://svm.research.bell-labs.com/SVT/SVMsvt.html
Finding nonlinear surfaces • How to modify algorithm to find nonlinear surfaces? • First idea (simple and effective): map each data point into a higher dimensional space, and find a linear fit there • Example: Find a quadratic surface for • Use new coordinates in regular linear SVM • A plane in this quadratic space is equivalent to a quadratic surface in our original space
Problems with this method • If dimensionality of space is high, lots of calculations • For a high polynomial space, combinations of coordinates explodes • Need to do all these calculations for all training points, and for each testing point • Infinite dimensional spaces impossible • Nonlinear surfaces can be used without these problems through the use of a kernel function.
The Dual Problem • The dual SVM is an alternative approach. • Wrap a “string” around all the data points. • Find the two points, one on each “string”, which are closest together. Connect the dots. • The perpendicular bisector to this connection is the best classification plane. Class 1 Class -1
x3 x1 x2 The Dual Variable, or “Importance” • Every point on the “string” is a linear combination of the points inside the string. • In general: • a’s are referred to as dual variables, and represent the “importance” of each data point.
Two Equivalent Approaches • Both problems yield the same classification plane. • w,bcan be expressed in terms of • can be expressed in terms of w,b Class 1 Class -1 Class -1 Class 1 • Primal Problem: • Find best separating plane • Variables: w,b • Dual Problem: • Find closest points on “strings” • Variables:
How to generalize nonlinear fits • Traditional SVM: • Dual formulation: • Can find w and b in terms of . • But note: don't need any xi individually, just scalar products between points.
Kernel function • Dual formulation again: • Substitute scalar product with kernel function: • Using a kernel corresponds to having mapped the data into some high dimensional space, possibly an infinite one.
Traditional kernels • Linear • Polynomial • Gaussian
Another interpretation • Kernels can be thought of as a distance metric. • Linear SVM: determine class by sign of • Nonlinear SVM: determine class by sign of • Those support vectors that x is "closest to" influence its class selection.
Active Learning with SVMs • Given a set of unlabeled points that I can label at will, how do I choose which one to label next? • Common answer: choose a point that is on or close to the current separating hyperplane (Campbell, Cristianini, Smola; Tong & Koller; Schohn & Cohn) • Why?
On the hyperplane: Spin 1 • Assume data is linearly separable. • A point which is on the hyperplane (or at least in the margin) is guaranteed to change the results. (Schohn & Cohn)
On the hyperplane: Spin 2 • Intuition suggests that one should grab the point that is most wrong • Problem: don't know the class of the point yet • If you grab a point that is far from the hyperplane, and it is classified wrong, this would be wonderful • But: points which are far from the hyperplane are the ones which are most likely be correctly classified (Campbell, Cristianini, Smola)
Active Learning in Batches • What if you want to choose a number of points to label at once? (Brinker) • Could choose the n closest points to the hyperplane, but this is not optimal
Heuristic approach instead • Assumption: all hyperplanes go through origin • authors claim that this can be compensated for with appropriate choice of kernel • To have maximal effect on direction of hyperplane, choose points with largest angle
Defining angle • Let = mapping to feature space • Angle between points x and y:
Approach for maximizing angle • Introduce artificial point normal to existing hyperplane. • Choose next point to be one that maximizes angle with this one. • Choose each successive point to be the one that maximizes the minimum angle to previous point (i.e., minimizes the maximum cosine value)
What happened to distance? • In practice, use both measures: • want points closest to plane • want points with largest angular separation from others • Iterative greedy algorithm:value = * distance to hyperplane +(1-) * (largest cosine measure to an already existing point) • Choose the next point to be the one that minimizes this value • Paper has results: fairly robust to varying
Class 1 Class -1 Iterative Algorithms • Maintain the “importance,” or dual variable associated with all data points. • This is small, since it is a single dimensional array of size m. • Algorithm • Look at each point sequentially. • Update its importance. (How?) • Repeat until no further improvements in goal.
Iterative Framework • LSVM, ASVM, SOR, etc. are iterative algorithms on the dual variables. • Algorithm: (Assume that we have m data points.) for (i=0; i < m; i++) ai= 0; // Initialize dual variables while (distance between strings continues to shorten) for (i=0; i <m; i++) { Update aiaccording to the update rule (not shown here). } • Bottleneck: Repeated scans through the dataset. • Many of these data points are unimportant