Download

1 / 24
240 likes | 353 Vues
This presentation delves into the challenges and solutions related to visualizing and mining multi-variate and multi-dimensional datasets in the context of chemical research. It highlights the increasing generation of data through modern synthesis technologies, which creates a critical need for effective visualization and data mining tools. Key topics include the motivation for enhanced data representation, examples from ChemCodes and NCI databases, and demonstrations of interactive techniques such as 3D glyph-based and volume-based visualization tools tailored for chemical datasets.

E N D
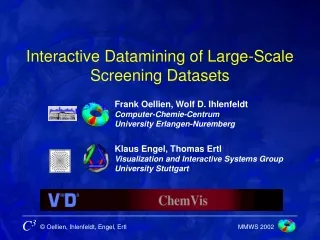
Interactive Datamining of Large-Scale Screening Datasets Frank Oellien, Wolf D. Ihlenfeldt Computer-Chemie-Centrum University Erlangen-Nuremberg Klaus Engel, Thomas ErtlVisualization and Interactive Systems Group University Stuttgart
Overview • Multi-variate and multi-dimensional datasets • Motivation • Information Visualization Techniques • Examples (ChemCodes Inc., NCI) • Demo
Overview • Multi-variate and multi-dimensional datasets • Motivation • Information Visualization Techniques • Examples (ChemCodes Inc., NCI) • Demo
Chemical data 18000000 16000000 Merck Katalog Synopsys PG 14000000 ACX 12000000 NCI DTP 10000000 ChemInform 8000000 Spresi 6000000 Beilstein 4000000 CAS Current datasets 2000000 0
Multi-Variate and Multi-Dimensional Numeric Datasets Today • Change in chemical synthesis technology • new technologies (HTS, combinatorial synthesis) • experiments generate terabytes of data per year • development of data mining and visualization tools could not keep pace • most critical bottleneck in R&D today ! • tools for interactive mining and information visualization are needed
Tools for Interactive Visualization of Multi-Variate and Multi-Dimensional Data • Standard applications • barchart, 2D and pseudo 3D scatter plots, molecular spreadsheets • limited to small subsets • platform-dependent • Our goal: applications that are • simple to use • allow straightforward interpretation of results • generalized access to tabular numeric data • platform-independent
Overview • Multi-variate and multi-dimensional datasets • Motivation • Information Visualization Techniques • Examples (ChemCodes Inc., NCI) • Demo
3D Tools for Interactive Information Visualization • Information Visualization Applications that uses 3D capabilities of modern clients • Glyph-based InfVis approaches • Volume-based InfVis approaches
Glyph-based InfVis Tools • 3 orthogonal axes • color • shape • size • transparency • surface effects • animation • up to ~100 Glyphs
Java/Java3D InfVis Applet • Java3DCanvas • Tool Panel • (filters, selection tools, details) • ControlPanel
Java/Java3D InfVis Applet3D Render Panel • 3D Glyphs • 3D Barchart
Dynamic Filter Tools • Selection Tools • Detail Tools Java/Java3D InfVis Applet3D Tool Panel
Advantages of Volume-based InfVis Tools • Databases with millions of data points • Glyph-based InfVis approaches • produce millions of geometricprimitives • interactive visualization not possible • Volume-based InfVis approaches • can handle large number of data points • interactive visualization using low-cost graphics hardware is possible
Overview • Multi-variate and multi-dimensional datasets • Motivation • Information Visualization Techniques • Examples (ChemCodes Inc., NCI) • Demo
ChemCodes Reaction Database • 100 most important FGs ~75% chemistry • 100 standard reactions • Limits of standard reactions • Functional Group Compatibility • Generating Rules • Goal: Analysis of the reaction space
ChemCodes - Reaction Optimization I • Goal: Reaction Optimization: > 95% Yield • 7 Dimensions:reagent, solvent, time, temperature,stoichiometry,reagent order,FG-compatibility
ChemCodes - Reaction Planning • FunctionalGroupCompatibilityCheck
Example 2: NCI Anti-tumor / Anti-viral Database • Initiated in April 1990 (modified 1994) • ~ 250.000 compounds • ~ 30.000 with anti-tumor screening data • Enhanced NCI Database Browser • > 30 different molecular properties • up to 23 3D conformers per compound
Overview • Multi-variate and multi-dimensional datasets • Motivation • Information Visualization Techniques • Examples (ChemCodes Inc., NCI) • Demo
Acknowledgment • Prof. Johann GasteigerComputer-Chemie-CentrumUniversity of Erlangen-Nuremberg • Prof. Thomas Ertl, Dipl. Inf. Klaus Engel Visualization and interactive SystemsUniversity of Stuttgart • Dr. Patrick Kiser, Dr. Gary Eichenbaum ChemCodes Inc. • Marc NicklausLaboratory of Medicinal ChemistryNCI, NIH • Deutsche Forschungsgemeinschaft