Download
1 / 13
160 likes | 395 Vues
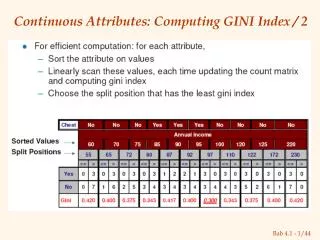
Christine Belledin NCSSM belledin@ncssm.edu . The Gini Index: Using calculus to measure inequity. DATA USED TO QUANTIFY DISTRIBUTION OF income. Percent distribution of aggregate income for sample data. DATA USED TO QUANTIFY DISTRIBUTION OF income.

E N D
Christine Belledin NCSSM belledin@ncssm.edu The Gini Index: Using calculus to measure inequity
Christine Belledin TCM 2010 DATA USED TO QUANTIFY DISTRIBUTION OF income Percent distribution of aggregate income for sample data
Christine Belledin TCM 2010 DATA USED TO QUANTIFY DISTRIBUTION OF income Cumulative percent distribution of aggregate income for sample data Cumulative proportion of aggregate income Proportion of population
What would the cumulative graph look like if the distribution was perfectly equitable? Perfectly inequitable? Christine Belledin TCM 2010 Perfect Equity and Perfect Inequity Perfect Equity Perfect Inequity Cumulative proportion of aggregate income Cumulative proportion of aggregate income Proportion of population Proportion of population
Christine Belledin TCM 2010 The Gini Index The ratio of the areas shown below.
The ratio can have a value anywhere from 0 to 1. • A Gini index of 0 represents perfect equity. • A Gini index of 1 represents perfect inequity. • The larger the ratio, the more inequitable the distribution of income. Christine Belledin TCM 2010 The Gini Index
Since (0, 0) and (1, 1) are always points on the curves, a reasonable model for this data is a power function of the form y = xn, with n > 1. We choose not to use a power least squares procedure to fit a power function to the data because a Lorenz curve must contain the point (1, 1), which is not guaranteed by this method. We will use the fact that a log-log re-expression linearizes data that is modeled by a power function. We now use our knowledge of calculus to find a least-squares estimate of n. Christine Belledin TCM 2010 Finding the Lorenz Curve using Least Squares
Consider the linear equation In our case, and We want to minimize This is a 1-variable optimization problem. Christine Belledin TCM 2010
Christine Belledin TCM 2010 Finding n
Christine Belledin TCM 2010 Another Option for n Your students may make another choice for the method used to find the exponent. As long as they are consistent in their procedure, important comparisons can me made.
Christine Belledin TCM 2010 Calculating the Gini Index
Christine Belledin TCM 2010 Method 1: n = 2.0886 Gini index = 0.3525 Comparison of Methods 1 and 2 for sample data Method 2: n = 2.4956 Gini index = 0.4278
Comparison of student measures to traditional Gini index. • Relative values of the Gini indices for years when the president is Democrat and for years when the president is Republican. • Investigating the historical events leading to the most drastic changes in the Gini index. • Comparison of Gini indices for different countries around the world. Christine Belledin TCM 2010 Student investigations