Download

1 / 23
250 likes | 566 Vues
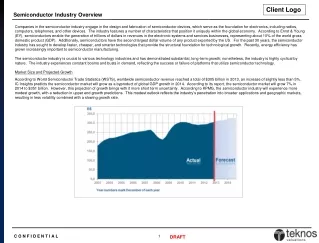
Short Background on the Semiconductor Industry. The leading industry in the IT revolution. Has significant influence on global economic cycles Relevant to almost all sectors of IT. Annual revenues of more then $150 billion, with average year to year growth of 17%. The Fabless Model.

E N D
Short Background on the Semiconductor Industry • The leading industry in the IT revolution. • Has significant influence on global economic cycles • Relevant to almost all sectors of IT. • Annual revenues of more then $150 billion, with average year to year growth of 17%.
The Fabless Model • only chip design. • No foundry. • Usually more focus then Integrated Device manufactures (IDM). • need to sale less to become profit and as a result are more flexible and can address niche markets as well as main segments.
Fablees History • began becoming relevant in the 70’s. • rapid growth in 90’s • Today, the fabless companies total annual revenues are more then $23 million which represent 15% of semiconductor annual revenues. • for the last decade fabless growth rates were higher then the semiconductor growth rates and it is expected that in 2010 fabless annual revenues will represent about 50% of the semiconductors revenues.
Market Sector/Application Percentage Wired Communication 31% Wireless Communication 23% PC Peripherals 17% Consumer 14% PC 10% Industrial Medical 2% Defense Industries 2% Automotives 1% Fabless Statistics Fabless Companies Primary Business by Market Sector
Technology Area Percentage Analog/Digital 37% Logic 21% Microprocessors 18% DSP 17% Memory 7% Fabless Statistics Fabless Companies Primary Business by technology
Geographic area of Fabless companies Percentage of total revenues /Number of companies North America 84% / 455 Europe 7% / 55 Asia 5% / 75 Israel 4% / 30 Fabless Statistics Fabless Companies Geographic distribution
Company & location Percentage TSMC - Taiwan 41% UMC - Taiwan 24% Chartered semi - US 10% American Microsystems - US 7% Other - worldwide 18% Fabless Statistics Geographic Distribution of Foundries serving Fabless Companies
Background to the Israeli Semiconductor Industry • Very strong microelectronic academic departments from early 60’s. • many Israeli engineers emigrated, in the 60’s, 70’s and 80’s to the silicon Valley to work in semiconductor companies. • First multinational semiconductor companies open Israeli R&D centers in the late 60’s and early 70’s (Motorola 64, IBM 72 and Intel 74). • Israeli engineers from silicon valley return to Israel in the 80’s and 90’s. • In 1984, first multinational semiconductor company open a foundry in Israel – Intel’s fab in Jerusalem. • structure changes in the Israeli economy – restructure of the military industries, the stability program, liberalization and globalization.
Background to the Israeli Fabless Industry • Small country for a semiconductor industry – fabless companies are smaller companies and have more floatability in changing technology sector. • Distance from the market – it is easier to export design then products. • Weak marketing abilities and weak in selling to the final costumer – selling to the semiconductor companies or selling through OEMs. • Strong R&D abilities – the most important factor is R&D. • Shortage of capital and weak capital markets – less capital needed to fablees companies and less risk. • Unstable area – fabless companies have more floatability in changing location.
Israeli Statistics • chip design and semiconductor is the most important sector in the Israeli Hi-tech. • In 2000, more then quarter of the M&A deals in the Israeli Hi-tech were related to semiconductors and chip design. • In 2000, Galileo was acquired by Marwell for $2.7B and Visiontech was acquired by Broadcom for $700M. • In 1999, DSPC was acquired by Intel for $1.6B and Libit was acquired by TI for $465M. • Today, there are at least 3 semiconductor startups among the top 10 private startup in Israel (Saifun, Mobilian, Ezchip).
Case Studies – the Sample • 15 startup companies (11 chip design companies and 4 related industries). • Fairly representative with small biases to more successful startups. • Technologies applying to 7 different categories. • The companies were established in 4 phases of the Israeli VC industry. • large difference in success (failures to tremendous successes). • Few geographic areas.
Methodology • Background. • Initial Mapping of the Israeli chip design companies. • Deep research on 15 chip design startup companies. • Interviews with most of these startup companies. • Analyzing the sample results. • Building an Initial Growth Model. • Initial policy implications. • Understanding the fundamentals of Italy chip design sector and adjusting the model to Italy. • Increasing the sample - checking and expanding the growth model. • Policy Implications.
Entrepreneur Background • Very strong educational background (10 PhD, 3 M.Sc EE and 2 B.Sc EE). • Strong Work experience background (7 MNE, 5 SU, 3 IDF, 4 Academia). • Strong managerial experience (7 manager positions, 2 entrepreneurs). • Strong core additional team (5 very strong, 5 strong). • Strong R&D position experience (15 R&D positions).
Trigger and Foundation • Most startups were lead by the scientists and the technology developer (12 startups). • We believe that half of the startup would have established even if the market condition were less attractive (driven by very strong technology). • We found few kind of triggers (development in academia, development during previous works and problem solving). • At least 7 startups were triggered by the Nasdaq good conditions. • Two startups were in technology incubators. • Two startup were spin-offs from established companies. • most startup had long maturation process from initial idea to establishment.
Business Model • The technology innovation: 5 specific products, 6 platform technology and 4 radical technology. • Becoming more focus in areas of development: 6 more focus, 6 no change and 3 broadened. • Marketing model: 5 direct sales, 6 OEMs and 8 strategic and marketing partnerships. • Growth Profiles: 2 IPO and M&A, 2 IPO, 2 fast M&A, 1 M&A as last rescue and 8 not clear yet.
Strong entrepreneur background Additional strong initial team Strong technology in a significant segment Path 4 OEM or/and Strategic agreements Fast M&A Path 3 IPO IPO Path 2 M&A Path 1 Optimal Growth Profiles
Explanation of the Model Path 1: companies with all characteristics of optimal profile of growth, which underwent successful IPO and were later acquired by a large multinational company (2 companies in our sample). Path 2: companies with all characteristics of optimal profile of growth, which had gone trough a successful IPO (2 companies in our sample). Path 3: companies with all characteristics of optimal profile of growth, which were acquired by a large multinational company in the beginning of their marketing and strategy alliances efforts (1 company in our sample). Path 4: companies that seems to have all characteristics of optimal profile of growth but are only in an initial phase of marketing and strategic agreements (2-5 companies in our sample).
Path1 (Very Successful Companies) companies with founders with very strong background and experience and very strong technology. These factors often leverage the company into strong OEM and strategic agreements with leading multinational companies. The companies’ initial success enables them to go through a successful IPO, which helps them keep growing. Later on, when the technology gap closed and the market consolidation in their segment began, they were attractive enough to be acquired be one of the competitors for a significant amount. In Israel, we identified 2 companies, which have gone through path1.
Path2 (Tremendous Success or Moderate Success) path2 is divided to 2 types of companies. Type1 (tremendous success) - companies with the same characteristics of companies in path1 (or maybe even stronger background and technology), which went through successful IPO and succeeded in leveraging their initial advantages better than companies from path1, and as a result succeeded in staying independent companies despite the consolidation on the market. These companies are market leaders in their segment and become large multinational companies. Type2 (moderate success) - companies with weaker characteristics of companies in path1 (weaker background and technology or technology which applies to less significant market segments), which went through successful IPO but were not attractive enough when the market consolidation began and as a result were not acquired and remained a medium company. In Israel, we identified 6-8 companies, which have gone through path2 (most of them from type2 but same may become type1).
Path3 (Successful Companies or Successful Technology Exits) Paths3 is divided into 2 types of companies. Type1 – companies with very strong technology in a significant segment that due to weak managerial capabilities or due to entrepreneur preferences decided to make an early sale exit. These companies due to their very strong technology, were able, in spite of their early stage, to be acquired for a significant amount. Type2 – companies with strong technology but with weak managerial abilities and/or work experience that their only chance to have any profit from the startup was to sell their technology/company in an early stage for a moderate amount. In Israel, we identified 3-4 companies, which have gone through path3 (only 1 was from type1).
Path4 (Young Startups) companies that suit the model but are still too young to determine which path they will pursue. We believe that most companies that don’t suit the growth profile have small chances of becoming successful companies in the chip design sector. Most of the startups that suit the model fit into it sooner or later.
Research Summary We believe that most companies that don’t suit the growth profile have small chances of becoming successful companies in the chip design sector. Most of the startups that suit the model fit into it sooner or later. We identified between seven to ten companies in our sample that fit this model, and five of these were already successful (between moderate success and tremendous success). We believe that in most cases our model can be helpful to policy makers in choosing an appropriate policy/program to use in order to promote chip design companies and the successful growth of the chip design sector. We also believe that this model can be helpful to venture capitalists as a checklist prior to any investment in this sector. Moreover, this model can help the entrepreneur to decide whether they are ready to establish their own startup.