Download
1 / 29
310 likes | 890 Vues
Ship to Shore – Advanced Business-Related Information Literacy Skills Value Line Company Reports Business-Related Information Literacy Skills Value Line Company Profiles You will learn: How to find Articles Company Profiles Industry Profiles Country Reports Market Research Reports

E N D
Ship to Shore – AdvancedBusiness-Related Information Literacy Skills Value Line Company Reports Shippensburg University, Ship to Shore - ADVANCED Business-Related Information Literacy Skills
Value Line Company Profiles Shippensburg University, Ship to Shore - ADVANCED
You will learn: How to find • Articles • Company Profiles • Industry Profiles • Country Reports • Market Research Reports Shippensburg University, Ship to Shore - ADVANCED
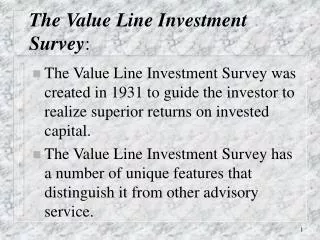
Value Line is good for • Finding Company Reports which include • Ratings of financial strength • Expert views of each company discussed. Shippensburg University, Ship to Shore - ADVANCED
Choose Databases Shippensburg University, Ship to Shore - ADVANCED
Timeliness The Timeliness rank is Value Line's measure of the expected price performance of a stock for the coming six to 12 months relative to our approximately 1,700 stock universe. Stocks ranked 1 (Highest) and 2 (Above Average) are likely to perform best relative to the approximately 1,700 stocks we follow. Stocks ranked 3 are likely to be average performers. Stocks ranked 4 (Below Average) and 5 (Lowest) are likely to underperform stocks ranked 1 through 3 in Value Line's universe. Shippensburg University, Ship to Shore - ADVANCED
How To Use The Value Line Investment Survey Page • The Value Line Ranks: Timeliness, Safety, Technical; • The Analyst's Commentary; • Financial Estimates; • Historical Financial Data; • Annual Rates (of Change); • Target Price Range; • Projections (of 3- to 5-year stock prices); • Price/Earnings Ratios. Shippensburg University, Ship to Shore - ADVANCED
7 • 3- to 5-year Projections • In the left hand column of each report, there is also a box which contains 3- to 5-year Projections for a stock price. There you can see the potential high and low average prices we forecast, the % price changes we project, and the expected compound annual total returns (price appreciation plus dividends). To make these calculations, analysts compare the expected prices out 3 to 5 years into the future (as shown in the Target Price Range and Projections box) with the recent price shown on the top of the report. • Investors whose primary goal is long-term price appreciation should study the 3- to 5-year projections carefully and choose stocks with above-average appreciation potential. For comparative purposes, you can find the Estimated Median Price Appreciation Potential for all approximately 1,700 stocks on the front page of the Summary & Index. Shippensburg University, Ship to Shore - ADVANCED
8 • 8.Price/Earnings Ratios • Information about Price/Earnings Ratios appears at the very top of the Value Line Page as well as in the statistical section in the center. • A Price/Earnings Ratio (often referred to as a P/E Ratio or simply a P/E) is probably the most widely used statistic in investing. • It is calculated by dividing the price of a stock (usually the current price) by twelve months of earnings. If, for example, a stock is selling at $40 a share and its annual earnings are $2.00 a share, its P/E is 20. • Few investors will buy a stock without knowing what its P/E is. Most frequently, investors will compare the P/E of one stock with that of another before making a decision to purchase or sell. Shippensburg University, Ship to Shore - ADVANCED
Help in Valueline • How to use the Valueline page Shippensburg University, Ship to Shore - ADVANCED
You have learned: • What Business Source Premier is and what it is good at finding • How to search using a keyword • How to sort your search results by journal or magazine • How to find Company Profiles Shippensburg University, Ship to Shore - ADVANCED