Download
1 / 7
70 likes | 302 Vues
Graphing Linear Inequalities in Two Variables. SWBAT graph a linear inequality in two variables SWBAT Model a real life situation with a linear inequality. Some Helpful Hints. If the sign is > or < the line is dashed If the sign is or the line will be solid

E N D
Graphing Linear Inequalities in Two Variables • SWBAT graph a linear inequality in two variables • SWBAT Model a real life situation with a linear inequality.
Some Helpful Hints • If the sign is > or < the line is dashed • If the sign is or the line will be solid • When dealing with just x and y. • If the sign > or the shading either goes up or to the right • If the sign is < or the shading either goes down or to the left
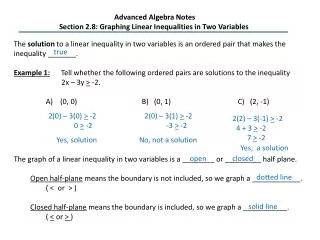
When dealing with slanted lines • If it is > or then you shade above • If it is < or then you shade below the line
Graphing an Inequality in Two Variables Graph x < 2 Step 1: Start by graphing the line x = 2 Now what points would give you less than 2? Since it has to be x < 2 we shade everything to the left of the line.
Graphing a Linear Inequality Sketch a graph of y 3
Using What We Know Sketch a graph of x + y < 3 Step 1: Put into slope intercept form y <-x + 3 Step 2: Graph the line y = -x + 3
Graphing 2-Variable Absolute Value Inequalities • Graph the inequality using appropriate lines • Shade above the “V” for > and • Shade below the “V” for < and