Download

1 / 21
330 likes | 616 Vues
9.3 Linear Inequalities in Two Variables. Objective 1 . Graph linear inequalities in two variables. Slide 9.3- 2. Graph linear inequalities in two variables. Slide 9.3- 3. Graph linear inequalities in two variables.

E N D
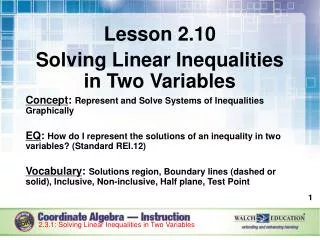
Objective 1 Graph linear inequalities in two variables. Slide 9.3- 2
Graph linear inequalities in two variables. Slide 9.3- 3
Graph linear inequalities in two variables. Consider the graph. The graph of the line x + y = 5 divides the points in the rectangular coordinate system into three sets: 1. Those points that lie on the line itself and satisfy the equation x + y = 5 [like (0, 5), (2, 3), and (5, 0)]. This line, called the boundary line, divides the two regions in the plane that are graphed by the following two inequalities. 2. Those that lie in the half-plane above the line and satisfy the inequality x + y > 5 [like (5, 3) and (2, 4)]; 3. Those that lie in the half-plane below the line and satisfy the inequality x + y < 5[like (0, 0) and (–3, –1)]. Slide 9.3- 4
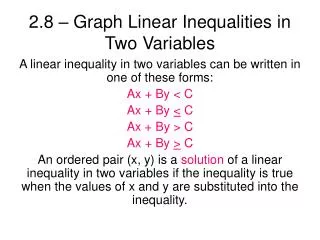
Graph linear inequalities in two variables. Graphing a Linear Inequality Step 1Draw the graph of the straight line that is the boundary.Make the line solid if the inequality involves ≤ or ≥. Make the line dashed if the inequality involves < and >. Step 2Choose a test point.Choose any point not on the line, and substitute the coordinates of that point in the inequality. Step 3Shade the appropriate region.Shade the region that includes the test point of it satisfies the original inequality. Otherwise, shade the region on the other side of the boundary line. When drawing the boundary line in Step 1, be careful to draw a solid line if the inequality includes equality (≤, ≥) or a dashed line if equality is not included (<, >). Slide 9.3- 5
CLASSROOM EXAMPLE 1 Graphing a Linear Inequality Solution: Graph x + y≤ 4. Step 1Graph the line x + y = 4, which has intercepts (4,0) and (0, 4), as a solid line since the inequality involves “≤”. Step 2Test (0, 0). x + y= 4 True Slide 9.3- 6
CLASSROOM EXAMPLE 1 Graphing a Linear Inequality (cont’d) Step 3Since the result is true, shade the region that contains (0, 0). x + y≤ 4 Slide 9.3- 7
Graph linear inequalities in two variables. If the inequality is written in the form y > mx + b or y < mx + b, then the inequality symbol indicates which half-plane to shade. If y>mx + b, then shade above the boundary line; If y<mx + b, then shade below the boundary line; This method works only if the inequality is solved for y. A common error in using the method just described is to use the original inequality symbol when deciding which half-plane to shade. Be sure to use the inequality symbol found in the inequality after it is solved for y. Slide 9.3- 8
CLASSROOM EXAMPLE 2 Graphing a Linear Inequality Solution: Graph 3x + 4y < 12. Solve the inequalityfor y. 3x + 4y < 12 Graph the boundary line as a dashed line because the inequality symbol is <. Since the inequality is solved for y and the inequality symbol is <, we shade the half-plane below the boundary line. Slide 9.3- 9
CLASSROOM EXAMPLE 2 Graphing a Linear Inequality (cont’d) As a check, choose a test point not on the line, say (0, 0), and substitute for x and y in the original inequality. 3x + 4y < 12 3(0) + 4(0) < 12 0 < 12 True This decision agrees with the decision to shade below the line. Slide 9.3- 10
CLASSROOM EXAMPLE 3 Graphing a Linear Inequality with a Vertical Boundary Line Solution: The graph should include a dotted line since there is no equal sign in the equation. Graph y < 4. Since the statement is true the region beow the dotted line should be shaded. Slide 9.3-12
Objective 2 Graph an inequality with a boundary line through the origin. Slide 9.3- 12
Graph an inequality with a boundary line through the origin. If the graph of an inequality has a boundary line that goes through the origin, (0, 0) cannot be used as a test point. Slide 9.3- 13
CLASSROOM EXAMPLE 4 Graphing a Linear Inequality with a Boundary Line through the Origin Solution: The graph should include a solid line since there is an equality in the equation. Test point (1,1) is used. Graph x≥ −3y. Since the statement is true the region above the line should be shaded. If the graph of an inequality has a boundary line that goes through the origin, (0,0) cannot be used as a test point. Slide 9.3-15
Objective 3 Graph the intersection of two linear inequalities. Slide 9.3- 15
Graph the intersection of two linear inequalities. A pair of inequalities joined with the word and is interpreted as the intersection of the solution sets of the inequalities. The graph of the intersection of two or more inequalities is the region of the plane where all points satisfy all of the inequalities at the same time. Slide 9.3- 16
CLASSROOM EXAMPLE 5 Graphing the Intersection of Two Inequalities Solution: Graph x – y≤ 4 and x≥ –2. To begin graph each inequality separately. x – y ≤ 4 x ≥ –2 Slide 9.3- 17
CLASSROOM EXAMPLE 5 Graphing the Intersection of Two Inequalities (cont’d) Then we use shading to identify the intersection of the graphs. x – y≤ 4 and x ≥ –2 Slide 9.3- 18
Objective 4 Graph the union of two linear inequalities. Slide 9.3- 19
Graph the union of two linear inequalities. When two inequalities are joined by the word or, we must find the union of the graphs of the inequalities. The graph of the union of two inequalities includes all points satisfy either inequality. Slide 9.3- 20
CLASSROOM EXAMPLE 6 Graphing the Union of Two Inequalities Solution: Graph 7x – 3y < 21 or x > 2. Graph each inequality with a dashed line. The graph of the union is the region that includes all points on both graphs. 7x – 3y < 21 or x > 2 Slide 9.3- 21