Download
1 / 25
250 likes | 529 Vues
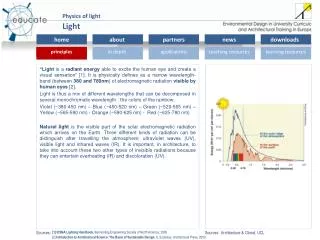
Light. Color Color Addition & Subtraction Spectra. What do we see?. Our eyes can’t detect intrinsic light from objects (mostly infrared), unless they get “ red hot ” The light we see is from the sun or from artificial light When we see objects, we see reflected light

E N D
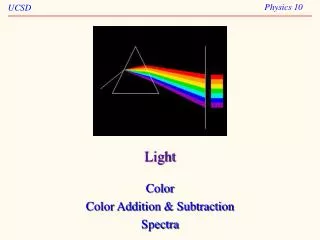
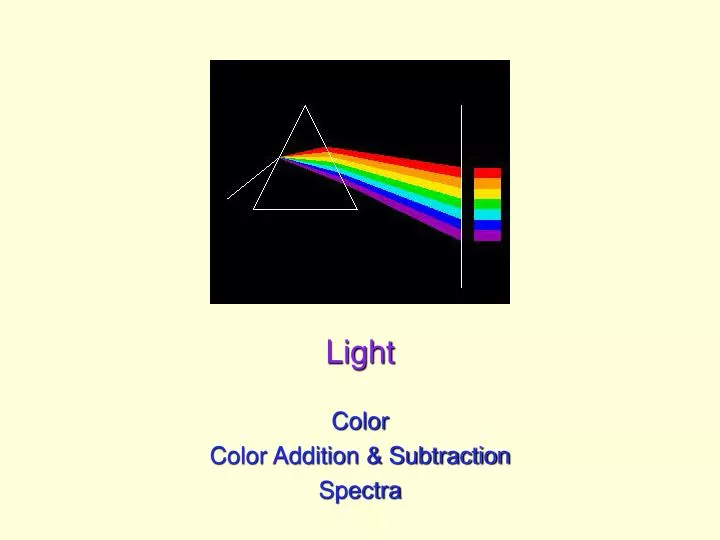
Light Color Color Addition & Subtraction Spectra
UCSD: Physics 8; 2006 What do we see? • Our eyes can’t detect intrinsic light from objects (mostly infrared), unless they get “red hot” • The light we see is from the sun or from artificial light • When we see objects, we see reflected light • immediate bouncing of incident light (zero delay) • Very occasionally we see light that has been absorbed, then re-emitted at a different wavelength • called fluorescence, phosphorescence, luminescence
UCSD: Physics 8; 2006 Colors • Light is characterized by frequency, or more commonly, by wavelength • Visible light spans from 400 nm to 700 nm • or 0.4 m to 0.7 m; 0.0004 mm to 0.0007 mm, etc.
UCSD: Physics 8; 2006 White light • White light is the combination of all wavelengths, with equal representation • “red hot” poker has much moreredthan blue light • experiment:red,green, and blue light bulbs make white • RGB monitor combines these colors to displaywhite combined, white light called additive color combination—works with light sources wavelength red light green light blue light
UCSD: Physics 8; 2006 Additive Colors • Red, Green, and Blue light sources can be used to synthesize almost any perceivable color • Red+ Green = Yellow • Red + Blue = Magenta • Green + Blue = Cyan • These three dual-source colors become the primary colors for subtraction • why? because absence of green is magenta • absence of red is cyan, etc.
UCSD: Physics 8; 2006 reflected yellow light (blue gone) incident white light blue absorption (e.g., paint, dye) yellow light made of red and green Subtractive colors • But most things we see are not light sources • Reflection takes away some of the incident light • thus the term subtractive • If incident light is white, yellowis absence of blue
UCSD: Physics 8; 2006 What’s responsible for selective absorption? • Carotene • makes carrots orange, tomatoes red, daffodils yellow, leaves turn • must absorb blue light • Long, organic molecular chain • most dyes, pigments are such • resonances in optical light • Chlorophyll • makes leaves green • must absorb red and blue
UCSD: Physics 8; 2006 Questions • Why, when you mix all your paints together, do you just get dark brown or black? Why not white? • Why is the sky blue, and the low sun/moon orange? Are these related?
UCSD: Physics 8; 2006 Our limited sensitivity to light • In bright-light situations (called photopic, using cones), our sensitivity peaks around 550 nm, going from 400 to 700 • In the dark, we switch to scotopic vision (rods), centered at 510 nm, going from 370 to 630 • it’s why astronomers like red flashlights: don’t ruin night vision
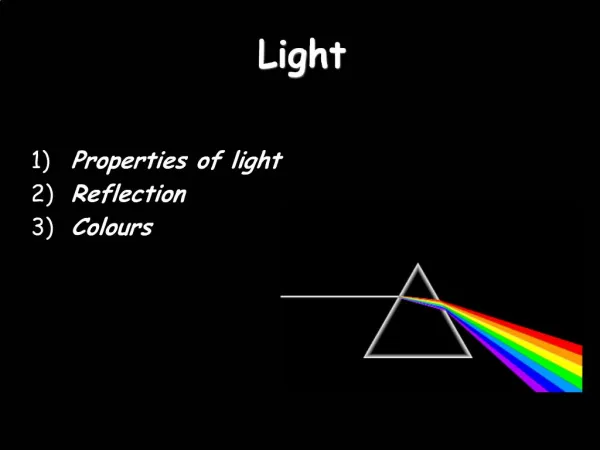
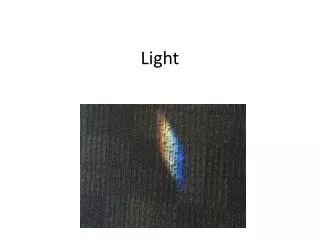
UCSD: Physics 8; 2006 Introduction to Spectra • We can make a spectrum out of light, dissecting its constituent colors • A prism is one way to do this • A diffraction grating also does the job • The spectrum represents the wavelength-by-wavelength content of light • can represent this in a color graphic like that above • or can plot intensity vs. wavelength • previous plots of blackbody spectrum were of this form
UCSD: Physics 8; 2006 Example Spectra white light spectrum hydrogen lamp spectrum helium lamp spectrum lithium lamp spectrum mercury lamp spectrum hydrogen absorption spectrum Spectra provide “fingerprints” of atomic species, which can be used to identify atoms across the universe! Solar Spectrum with Fraunhofer solar atmosphere absorption lines C: Hydrogen; D: Sodium; E: Iron; F: Hydrogen; G: Iron; H&K: Calcium
UCSD: Physics 8; 2006 Spectral Content of Light • A spectrum is a plot representing light content on a wavelength-by-wavelength basis • the myriad colors we can perceive are simply different spectral amalgams of light • much like different instruments have different sound: it depends on its (harmonic) spectral content
UCSD: Physics 8; 2006 Light Sources • Here are a variety of • light sources. Included • are: • H-ITT IR LED* • red LED* • green laser pointer • flourescence of • orange H-ITT trans- • mitter illuminated by • green laser • Note that light has to • be blue-ward (shorter • wavelength) of the • fluorescence for it to • work. * LED: Light Emitting Diode
UCSD: Physics 8; 2006 Colored Paper Reflected light (in this case, sunlight) off of paper appearing: blue green yellow orange red black aside from slight fluorescence in yellow paper, paper colors operate by reflection only: never peeks above 100% white paper would be a flat line at 100%
UCSD: Physics 8; 2006 Fluorescent Paper Bright fluorescent paper follows different rules: absorbs blue or UV light and re-emits at some characteristic wavelength. These examples are of lime greenpaper and bright orange fluorescent paper. Note especially in the orange case, the light exceeds the amount that would be passively reflected off of white paper (100% level)
UCSD: Physics 8; 2006 Fluorescent Markers (hi-lighters) Likewise, fluorescent markers (hi-lighters) absorb and re-emit light. In this case, we see yellow, green, and pink fluorescent markers The pink actually has a bit of blue/violet in it, surprisingly All three have emission above the 100% that one gets from straight reflection
UCSD: Physics 8; 2006 Fluorescent lights • Fluorescent lights stimulate emission among atoms like argon, mercury, neon • they do this by ionizing the gas with high voltage • as electrons recombine with ions, they emit light at discrete wavelengths, or lines • Mercury puts out a strong line at 254 nm (UV) • this and other lines hit the phosphor coating on the inside of the tube and stimulate emission in the visible part of the spectrum
UCSD: Physics 8; 2006 LCD Monitor LCD monitors use fluorescent lights to illuminate the pixels (from behind). The black curve shows what my LCD laptop monitor looks like in a section of the screen that’s white. Blue, green, and red curves show sections of the screen with these colors Note that the colors are achieved simply by suppression Green gets all of this line Red gets all of this line Blue gets all of this line Thus LCDs just filter the background light
UCSD: Physics 8; 2006 Transmission of Glass, Sunglasses By obtaining a spectrum of sunlight reflected off of a piece of white paper (using the spectrograph without the fiber feed), then doing the same thing through the fiber and also through sunglasses, the trans- mission properties of each can be elucidated. The fiber is about 82% transmission for most wavelengths, but has significant UV absorption. This is why you can’t get sunburn through glass The sunglasses block UV almost totally!
UCSD: Physics 8; 2006 Sunlight and The Blue Sky These plots show the spectrograph’s response to sunlight on white paper and to the blue sky. The spectrograph is not very efficient in UV or IR, and its sensitivity curve is shown in black. You can notice the violet hump in the blue sky (brighter than white paper here). Also, can see the solar atmosphere absorption lines in both sun and sky sodium hydrogen calcium oxygen in earth atmos. hydrogen
UCSD: Physics 8; 2006 Blackbody corrected The spectrograph software lets you claim a source to be a black- body of specified temp- erature, so it can correct for its efficiency curve (black curve on prev.). Here we see the result of this process, which has made the sun curve look like a perfect blackbody peaking at 500 nm. But it also assumed that Fraunhoffer lines were artifacts to be removed Note the dramatic rise of the sky toward the blue/UV end. The lighter blue is without the UV-absorbing fiber in place
UCSD: Physics 8; 2006 More realistic spectrum Correcting the raw spectra from two slides back with the response curve, we arrive at a more realistic sun and sky spectrum. The black line is a black- body at 5900 K, which fits the sun reasonably well. This time, the absorption lines survive. The blue sky now also looks smoother, and on top of this is plotted a theoretical 1/4 model for molecular scattering Though not in words, this explains why the sky is blue!
UCSD: Physics 8; 2006 How do diffraction gratings work? • A diffraction grating is a regular array of optical scattering points • spherical wave emerges from each scattering point • constructively or destructively interfere at different angles depending on wavelength
UCSD: Physics 8; 2006 Another look at diffraction gratings • For a given wavelength, a special angle will result in constructive interference: dsin = • this angle is different for different wavelengths
UCSD: Physics 8; 2006 Assignments • HW 7: 14.E.8, 14.E.19, 14.E.20, 14.E.21, 15.E.26 • plus additional required problems on website, accessible through Assignments link • Read pp. 446–447, 454–455 to accompany this lecture • Read pp. 447–453 for Thursday, 6/1 • Extra Credit posted on course website • worth up to 3% of grade!!! • mostly involves building a spectrometer and exploring lots of things with it