Download
1 / 46
740 likes | 1.46k Vues
FORECASTING TECHNIQUES. Chapter 16 Qualitative Approaches to Forecasting Quantitative Approaches to Forecasting The Components of a Time Series Using Smoothing Methods in Forecasting Measures of Forecast Accuracy Using Trend Projection in Forecasting

E N D
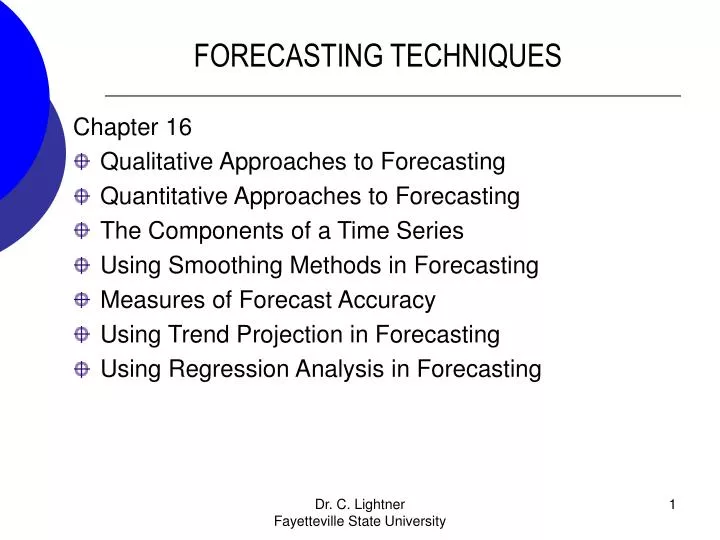
FORECASTING TECHNIQUES Chapter 16 • Qualitative Approaches to Forecasting • Quantitative Approaches to Forecasting • The Components of a Time Series • Using Smoothing Methods in Forecasting • Measures of Forecast Accuracy • Using Trend Projection in Forecasting • Using Regression Analysis in Forecasting Dr. C. Lightner Fayetteville State University
Forecasting Introduction • An essential aspect of managing any organization is planning for the future. • Organizations employ forecasting techniques to determine future inventory, costs, capacities, and interest rate changes. • There are two basic approaches to forecasting: -Qualitative -Quantitative Dr. C. Lightner Fayetteville State University
Qualitative Approaches to Forecasting • Delphi Approach • A panel of experts, each of whom is physically separated from the others and is anonymous, is asked to respond to a sequential series of questionnaires. • After each questionnaire, the responses are tabulated and the information and opinions of the entire group are made known to each of the other panel members so that they may revise their previous forecast response. • The process continues until some degree of consensus is achieved. Dr. C. Lightner Fayetteville State University
Qualitative Approaches (continued) • Scenario Writing • Scenario writing consists of developing a conceptual scenario of the future based on a well defined set of assumptions. • After several different scenarios have been developed, the decision maker determines which is most likely to occur in the future and makes decisions accordingly. Dr. C. Lightner Fayetteville State University
Qualitative Approaches (continued) • Subjective or Interactive Approaches • These techniques are often used by committees or panels seeking to develop new ideas or solve complex problems. • They often involve "brainstorming sessions". • It is important in such sessions that any ideas or opinions be permitted to be presented without regard to its relevancy and without fear of criticism. Dr. C. Lightner Fayetteville State University
Quantitative Approaches to Forecasting • Quantitative methods are based on an analysis of historical data concerning one or more time series. • A time series is a set of observations measured at successive points in time or over successive periods of time. • If the historical data used are restricted to past values of the series that we are trying to forecast, the procedure is called a time series method. • If the historical data used involve other time series that are believed to be related to the time series that we are trying to forecast, the procedure is called a causal method. • Quantitative approaches are generally preferred. In this chapter we will focus on quantitative approaches to forecasting. Dr. C. Lightner Fayetteville State University
Time Series Data • Time Series Data is usually plotted on a graph to determine the various characteristics or components of the time series data. • There are 4 Major Components: Trend, Cyclical, Seasonal, and Irregular Components. Dr. C. Lightner Fayetteville State University
Components of a Time Series • The trend component accounts for the gradual shifting of the time series over a long period of time. • Any regular pattern of sequences of values above and below the trend line is attributable to the cyclical component of the series. • The seasonal component of the series accounts for regular patterns of variability within certain time periods, such as over a year. • The irregular component of the series is caused by short-term, unanticipated and non-recurring factors that affect the values of the time series. One cannot attempt to predict its impact on the time series in advance. Dr. C. Lightner Fayetteville State University
Time Series Data • We will learn the following Forecasting Approaches: Smoothing Trend Projections Dr. C. Lightner Fayetteville State University
Excel Instructions for Drawing a Scatter Plot • Enter data in the Excel spreadsheet. • Click on Insert on the toolbar and then click on the Chart tab. The Chart Wizard will appear. In step 1 on select the XY (scatter) chart type and then click next. • In step 2 specify the cells where your data is located in the data range box. • In step 3 you can give your chart a title and label your axes. In step 4 specify where you want the chart to be placed. Dr. C. Lightner Fayetteville State University
Example: Robert’s Drugs During the past ten weeks, sales of cases of Comfort brand headache medicine at Robert's Drugs have been as follows: WeekSalesWeekSales 1 110 6 120 2 115 7 130 3 125 8 115 4 120 9 110 5 125 10 130 Plot this data. Dr. C. Lightner Fayetteville State University
Plot Robert’s Drugs Example • Excel Spreadsheet Showing Input Data. Specify cells A4:B13 as the Data Range. Dr. C. Lightner Fayetteville State University
Plot Robert’s Drugs Example I labeled Robert’s Drug Example as The Chart title I labeled Sales as My Value (y) axis I labeled Week, t as My Value (x) axis Dr. C. Lightner Fayetteville State University
Smoothing Methods • In cases in which the time series is fairly stable and has no significant trend, seasonal, or cyclical effects, one can use smoothing methods to average out the irregular components of the time series. • Three common smoothing methods are: • Moving average • Weighted moving average • Exponential smoothing Dr. C. Lightner Fayetteville State University
Smoothing Methods: Moving Average • Moving Average Method The moving average method consists of computing an average of the most recent n data values for the series and using this average for forecasting the value of the time series for the next period. Dr. C. Lightner Fayetteville State University
Robert Drug’s Example: Moving Average Our scatter plot for Robert’s Drug Sales has no significant trend, seasonal, or cyclical effects. Thus we should employ a smoothing technique for forecasting sales. Forecast the sales for period 11 using a three period moving average (MA3). Dr. C. Lightner Fayetteville State University
Example: Robert’s Drugs: Moving Average • Steps to Moving Average Using Excel Step 1: Select the Tools pull-down menu. Step 2: Select the Data Analysis option. Step 3: When the Data Analysis Tools dialog appears, choose Moving Average. Step 4: When the Moving Average dialog box appears: Enter B4:B13 in the Input Range box. Enter 3 in the Interval box. Enter C5 in the Output Range box. Select OK. This specifies the value of n This is the column following our data, and one row below where our data begins. Dr. C. Lightner Fayetteville State University
Robert’s Drugs: Moving Average • MA3 (Three period Moving average) for Robert’s Drug Example Ft is the forecast for week t. F4 (forecast for week 4)=116.7 F11 (forecast for week 11)=118.3 Thus we would forecast the sales for Week 11 to be 118.3 Dr. C. Lightner Fayetteville State University
Smoothing Methods: Weighted Moving Average • Weighted Moving Average Method The weighted moving average method consists of computing a weighted average of the most recent n data values for the series and using this weighted average for forecasting the value of the time series for the next period. The more recent observations are typically given more weight than older observations. For convenience, the weights usually sum to 1. • The regular moving average gives equal weight to past data values when computing a forecast for the next period. The weighted moving average allows different weights to be allocated to past data values. There is no Excel command for computing this so you must do this manually. You can either manually enter the formulas into excel and apply to all periods or compute value by hand. Dr. C. Lightner Fayetteville State University
Smoothing Methods: Weighted Moving Average • Use a 3 period weighted moving average to forecast the sales for week 11 giving a weight of 0.6 to the most recent period, 0.3 to the second most recent period, and 0.1 to the third most recent period. F11 = (0.6)*130 + (0.3)*110 + (0.1)* 115= 122.5 Thus we would forecast the sales for week 11 to be 122.5. Sales for 3rd most recent period Sales for the most recent period Sales for 2nd most recent period Dr. C. Lightner Fayetteville State University
Smoothing Methods: Exponential Smoothing • Exponential Smoothing • Using exponential smoothing, the forecast for the next period is equal to the forecast for the current period plus a proportion () of the forecast error in the current period. • Using exponential smoothing, the forecast is calculated by: Ft+1= Yt + (1- )Ft where: is the smoothing constant (a number between 0 and 1) Ft is the forecast for period t Ft +1 is the forecast for period t+1 Yt is the actual data value for period t This is the same as Ft+1 = Ft + α (Yt – Ft) Dr. C. Lightner Fayetteville State University
Robert’s Drugs: Exponential Smoothing Forecast the sales for period 11 using Exponential Smoothing α= 0.1. Dr. C. Lightner Fayetteville State University
Robert’s Drugs: Exponential Smoothing Steps to Exponential Smoothing Using Excel Step 1: Select the Tools pull-down menu. Step 2: Select the Data Analysis option. Step 3: When the Data Analysis Tools dialog appears, choose Exponential Smoothing. Step 4: When the Exponential Smoothing dialog box appears: Enter B4:B13 in the Input Range box. Enter 0.9 (for a = 0.1) in Damping Factor box. Enter C4 in the Output Range box. Select OK. Damping factor is always 1-α Dr. C. Lightner Fayetteville State University
Robert’s Drugs: Exponential Smoothing F11 = 0.1 * Y10 + .9 F10 = .1 *130 + .9 * 115.4099 = 116.87 Thus we would forecast sales for week 11 to be 116.87 Dr. C. Lightner Fayetteville State University
Questions That You Should Be Asking • For the Moving Average technique, how do I determine the best value of n to use for forecasting? • For Exponential Smoothing, how do I determine the best value of α to use? • If I realize that a smoothing technique should be employed, how do you know which smoothing technique is best? In order to answer the above questions, we need criteria for judging the accuracy of a forecasting technique. Once we select a criterion, the method (or parameter) which provides the best value for our criterion is the best method (or parameter) to use for forecasting our scenario. Dr. C. Lightner Fayetteville State University
Measures of Forecast Accuracy • Mean Squared Error (MSE) The average of the squared forecast errors for the historical data is calculated. The forecasting method or parameter(s) which minimize this mean squared error is then selected. • Mean Absolute Deviation (MAD) The mean of the absolute values of all forecast errors is calculated, and the forecasting method or parameter(s) which minimize this measure is selected. The mean absolute deviation measure is less sensitive to individual large forecast errors than the mean squared error measure. You may choose either of the above criteria for evaluating the accuracy of a method (or parameter). Dr. C. Lightner Fayetteville State University
Selecting the best Smoothing Technique for Robert’s Drugs • Determine the smoothing technique that is best for forecasting Robert’s Drug sales: A two period moving average, a three period moving average, exponential smoothing (α=0.1), or exponential smoothing (α=0.2) Realistically we should have experimented with more values of n for the moving average, and α for exponential smoothing to determine the absolute best parameters to use for our technique. On the next slide we randomly chose to use the MSE criterion to judge the best technique. Dr. C. Lightner Fayetteville State University
Robert’s Drugs :Comparing Smoothing Techniques Double click on the Excel sheet below to enter actual Excel spreadsheet that I created. Clicking on individual cells will provide the formulas that were entered to compute the observed values. MSE for MA2 Dr. C. Lightner Fayetteville State University
Robert’s Drugs :Comparing Smoothing Techniques MSE for MA3 Dr. C. Lightner Fayetteville State University
Robert’s Drugs :Comparing Smoothing Techniques MSE for Exponential Smoothing α=0.1 Dr. C. Lightner Fayetteville State University
Robert’s Drugs :Comparing Smoothing Techniques MSE for Exponential Smoothing α=0.2 Dr. C. Lightner Fayetteville State University
Robert’s Drugs :Comparing Smoothing Techniques • Since the three period moving average technique (MA3) provides to lowest MSE value, this is the best smoothing technique to use for forecasting Robert’s Drug Sales. Dr. C. Lightner Fayetteville State University
Trend Projection • If a time series exhibits a linear trend, the method of least squares may be used to determine a trend line (projection) for future forecasts. • Least squares, also used in regression analysis, determines the unique trend line forecast which minimizes the mean square error between the trend line forecasts and the actual observed values for the time series. • The independent variable is the time period and the dependent variable is the actual observed value in the time series. Dr. C. Lightner Fayetteville State University
Trend Projection • Using the method of least squares, the formula for the trend projection is: Yt= b0 + b1t. where: Yt = trend forecast for time period t b1 = slope of the trend line b0 = trend line projection for time 0 b1 = n tYt - tYt nt 2 - (t )2 where: Yt = observed value of the time series at time period t = average of the observed values for Yt = average time period for the n observations Dr. C. Lightner Fayetteville State University
Example: Auger’s Plumbing Service The number of plumbing repair jobs performed by Auger's Plumbing Service in each of the last nine months are listed below. MonthJobsMonthJobsMonthJobs March 353 June 374 September 399 April 387 July 396 October 412 May 342 August 409 November 408 Forecast the number of repair jobs Auger's will perform in December using the least squares method. Dr. C. Lightner Fayetteville State University
Auger’s Plumbing Service: Trend Projection • Trend Projection (month) tYttYtt 2 (Mar.) 1 353 353 1 (Apr.) 2 387 774 4 (May) 3 342 1026 9 (June) 4 374 1496 16 (July) 5 396 1980 25 (Aug.) 6 409 2454 36 (Sep.) 7 399 2793 49 (Oct.) 8 412 3296 64 (Nov.) 9 408 3672 81 Sum 45 3480 17844 285 Dr. C. Lightner Fayetteville State University
Example: Auger’s Plumbing Service • Trend Projection (continued) = 45/9 = 5 = 3480/9 = 386.667 ntYt - t Yt (9)(17844) - (45)(3480) b1 = = = 7.4 n t 2 - (t)2 (9)(285) - (45)2 = 386.667 - 7.4(5) = 349.667 Thus our trend line is Yt= 349.667 + 7.4 t. Y10 = 349.667 + (7.4)(10) = 423.667 For December t=10 Dr. C. Lightner Fayetteville State University
Auger’s Plumbing Service: Trend Line in Excel Excel Spreadsheet Showing Input Data Dr. C. Lightner Fayetteville State University
Example: Auger’s Plumbing Service • Steps to Trend Projection Using Excel Step 1: Select an empty cell (B13) in the worksheet. Step 2: Select the Insert pull-down menu. Step 3: Choose the Function option. Step 4: When the Select Category dialog box appears: Choose Statistical in Function Category box. Choose Forecast in the Function Name box. Select OK. Step 5: When the Forecast dialog box appears: Enter 10 in the x box (for month 10). Enter B4:B12 in the Known y’s box. Enter A4:A12 in the Known x’s box. Select OK. Dr. C. Lightner Fayetteville State University
Example: Auger’s Plumbing Service • Spreadsheet Showing Trend Projection for Month 10 Dr. C. Lightner Fayetteville State University
Roberts Drug Example • Suppose we neglected to plot Robert’s Drug example, and therefore we do not know that a trend does not exist. Use trend analysis to forecast the sales for month 11. Dr. C. Lightner Fayetteville State University
Question???? • How could we use the MSE or MAD to verify that the MA3 is a better smoothing technique than trend analysis for Robert’s Drug Sales data? Dr. C. Lightner Fayetteville State University
Causal Method: Regression Analysis • Regression Analysis is similar to trend analysis, except the independent variable is not restricted to time. Refer to Robert’s Drug example. Instead of letting time represent our independent variable, we could forecast sales based upon the price of the product. Since products often go on sale, we could collect data over several months collecting the weekly price and number of items sold for the week. For this model, we would find the regression equation in the same manner in which we found the trend line except we would call the independent variable x, instead of t. Dr. C. Lightner Fayetteville State University
Regression Equation • Using the method of least squares, the formula for the regression line is: Y = b0 + b1x. where: Y= dependent variable which depends on the value of x b1 = slope of the regression line b0 = regression line projection for x= 0 b1 = n XiYi - XiYi nXi2 - (Xi)2 where: Yt = observed value of the time series at time period t = average of the observed values for Yt = average time period for the n observations Dr. C. Lightner Fayetteville State University
Regression Analysis in Excel • The dependent variable Y can predicted using the same forecast function in Excel as used to forecast a trend line. Follow the same steps provided on slide 39. Dr. C. Lightner Fayetteville State University
THE END See your textbook for more examples and detailed explanations of all topics discussed in these notes. Dr. C. Lightner Fayetteville State University