Download
1 / 13
130 likes | 283 Vues
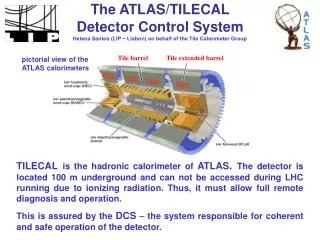
Muons in Atlas TileCal G4 vs G3 vs TB. Iouri Gavrilov (IHEP,Protvino,Russia). Geant4 vs Geant3 and TB. G4 version : Geant4.4.1 (QGSP_1) G4 range cut : 0.1 mm G3 : from Tomas Davidek Data calibration was performed using electrons (both MC and TB)

E N D
Muons in Atlas TileCalG4 vs G3 vs TB Iouri Gavrilov (IHEP,Protvino,Russia)
Geant4 vs Geant3 and TB • G4 version : Geant4.4.1 (QGSP_1) • G4 range cut : 0.1 mm • G3 : from Tomas Davidek • Data calibration was performed using electrons (both MC and TB) and Landau*Gauss fit (which is better than Moyal fit) I.Gavrilov, G4 Physics Validation of LHC Simulation
Muons at -90 deg • Energy 180 GeV • Tilerow 5 • Photostatistics effects: 40 pe/GeV (in production barrel cells) I.Gavrilov, G4 Physics Validation of LHC Simulation
-90 deg , tilerow 5, energy 180 GeV I.Gavrilov, G4 Physics Validation of LHC Simulation
-90 deg , tilerow 5, energy 180 GeV Muons at 90 degrees Top plot – normalization with 20 GeV electrons Bottom plot – normalization with muon peak G4 better predicts TB data I.Gavrilov, G4 Physics Validation of LHC Simulation
Muons: eta-scan • Energy 180 GeV h= 0.15, 0.25, 0.35, 0.55, 0.65, 0.75 • Photostatistics effects: 53 pe/GeV • Next slides: • Top plot – normalization with 20 GeV electrons • Bottom plot – normalization with muons at h= 0.35 • Fit is made with Landau*Gauss convolution I.Gavrilov, G4 Physics Validation of LHC Simulation
h= 0.15 • G4 better simulates data I.Gavrilov, G4 Physics Validation of LHC Simulation
h= 0.25 • G4 is better I.Gavrilov, G4 Physics Validation of LHC Simulation
h= 0.35 • G4 is better I.Gavrilov, G4 Physics Validation of LHC Simulation
h= 0.55 • G4 is better I.Gavrilov, G4 Physics Validation of LHC Simulation
h= 0.65 • Both G4 and G3 do not succeed in predicting TB data, but G4 seems to be better I.Gavrilov, G4 Physics Validation of LHC Simulation
h= 0.75 • G4 fails I.Gavrilov, G4 Physics Validation of LHC Simulation
Conclusions and Future Plans • G4 predicts better the TB data • But situation is unclear at large • Problems with e- calibration • Simulation at different energies & • Optimization of range/energy cuts I.Gavrilov, G4 Physics Validation of LHC Simulation