Download
1 / 18
180 likes | 336 Vues
An Introduction to Fourier and Wavelet Analysis: Part I. Norman C. Corbett Sunday, September 28, 2014. Motivation. Search for patterns, periodicity or recurrent features in nature An important element in the (stable) behaviour of many physical systems Examine the long profile of rivers

E N D
An Introduction to Fourier and Wavelet Analysis:Part I Norman C. Corbett Sunday, September 28, 2014
Motivation • Search for patterns, periodicity or recurrent features in nature • An important element in the (stable) behaviour of many physical systems • Examine the long profile of rivers • Contribute to the debate about the periodicity of step-pool sequences
Signals • Variety of definitions • Real valued functions of one or more independent variables • Serve as mathematical models for quantities that vary in time and/or space • Denote a generic signal by s(t)
Signals • Some examples: • The voltage v(t) in an electrical circuit as a function of time t • A black and white image I(x,y) • What about a colour image? • The density r(s) of tissue along a curvilinear path through a human brain • The long profile of a river E(d)
A Diatribe of Periodicity • No real world signal is strictly periodic! • Noise, friction, etc. crash the party. • Check periodicity by constructing a phase plane plot: • It’s easy to make an a-periodic signal s1 s2
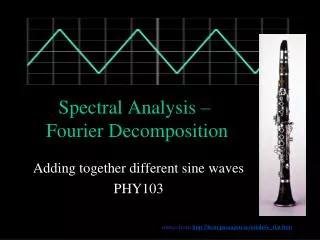
Sinusoids • The search for periodicity is the search for the sinusoidal components of a signal • General sinusoid • AmplitudeA (units of observed quantity) • Frequencyf (Hz: cycles/s) or wave numbern (1/m) • Angular frequency w =2p f (radians/s) • PeriodT (s) or wavelengthl (m) • Phase anglef (radians)
An Example • What sinusoidal components do you see in the graph of? • That was easy. What about this one? • Picking out the periodic components of a general signal is very difficult All real world signals contain noise! s1 s2
Fourier to the Rescue! • The continuous Fourier transform (CFT) where • “Compare” s(t) to a family of complex exponentials indexed by frequency f • CFT of noisy sinusoid Fs2
Another Example • Define s(t) by rectangular pulse • The CFT is
Complex Numbers • The CFT s(t) is complex number. • A complex number is a point in the complex plane • Real parta • Imaginary partb • Magnitude • Argument
Spectrum • Since the CFT is complex, we compute • Amplitude spectrum • Spectral density (energy/power) • Sometimes look at phase spectrumf ( f ) • Amplitude spectrum of the rectangular pulse AS
Inverse Fourier Transform • The original signal can be recovered via • Implies that s(t) can be expressed as a “weighted sum” of complex exponentials • The magnitude of the weight is the amplitude spectrum
Computation • In practice we work with samples of s(t) on a finite interval [0,T] • Ts=T/N is the sampling period • Discrete Fourier transform (DFT)
Computation • Under suitable conditions • We can use the DFT to estimate the CFT at the discrete frequencies: est
Some Real World Signals • Look at the spectra of river profiles in terms of the periods (wavelength) • A smackrel of weather data: • Winnipeg monthly mean temperatures for the years Zim Bur Wpg
A Problem with Fourier • Real world signals are often nonstationary • The spectra of such signals are very complex • Detrending ensures first orderstationarity • The mean of the residuals is zero • Second and higher order moments may still evolve: • Variance, (auto)correlation, etc.
Yet Another Example • The two signals • Have similar amplitude spectra • Remove the noise and look at the underlying signals • The frequency of the second signal changes • Can’t see this by looking at spectra • Wavelets to the rescue! (TBC) s2 s3 Fs2 Fs3 cs2 cs3