Download
1 / 46
460 likes | 465 Vues
Learn about the common steps scientists use to gather information and solve problems in scientific research. Explore the stages of the scientific method, including problem/question formulation, research, hypothesis development, experimentation, analysis, conclusion, application, and theories/laws.

E N D
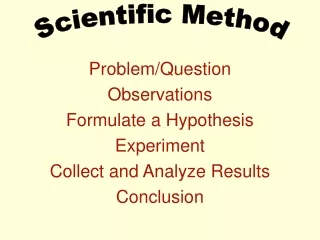
Scientific Method The Steps to Problem-solving in Scientific Research
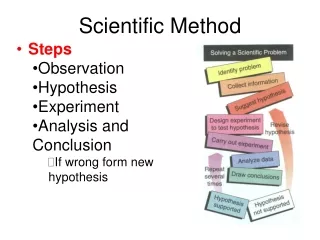
DefinitionScientific Method The common steps that scientists use to gather information to solve problems.
PROBLEM(QUESTION or OBSERVATION) • A question must be asked or a situation must be observed to begin the “experiment.”
Possible Observations… • * When “miracle-gro” is put on tomato plants, they grow into bigger plants produce better tomatoes
…Possible Questions? • *Is it really the “miracle-gro”?
2. RESEARCH • Gather information to develop hypothesis. • Inform yourself • What is miracle gro?, How does it work? What is suppose to do?
3. HYPOTHESIS • A testable explanation for a question or problem. ***NOT an “educated guess”***
Possible hypothesis • When placed on tomato plants and all other conditions (water, light, temp., soil) are stabilized, the miracle-grow will help to produce better plants.
4. EXPERIMENT….(or collection of data) • A procedure that tests a hypothesis by the process of collecting information under controlled conditions.
A controlled experiment • 2 parts • a. control group • b. experimental group
a. Control group • “The standard” -- in which all conditions are kept the same • *Ex.- the plants without the “miracle-gro”
b. Experimental group “The test group” -- in which all conditions are kept the same except for the single condition being tested. *Ex.- plants have “miracle-grow” added
Variables of controlled experiment • Independent variable – the condition of the experiment that is changed. (ex: the “miracle gro”) 2. Dependent variable – the condition that is observed/measured as result of the changed independent var. (the size of the tomatoes)
Hints for good experiments • Always follow safety guidelines • Make careful and detailed observations • Take precise notes of observations • Take precise recordings of numerical data
…more hints • Keep recordings/observations “honest” • Have an appropriate sample size • Keep an open mind • Continually ask questions • THINK!
5. ANALYSIS • Numerical data and observations are analyzed. • Interpret the data • Graphs, charts, etc may be created during this step.
CONCLUSION(Results) • Summarize the observations and data. • Make sure to state weather your hypothesis was correct or incorrect. • If it was correct you may begin to: • Share findings with colleagues and fellow scientists • May publish the findings in scientific journals • Other scientists will attempt to duplicate the experiment to “accept” the findings
7. Application • Apply the results to a real life situations • Some books/scientist really use this step some do NOT…if its just for you to know
8. THEORIES & LAWS A theory is an explanation of a natural phenomenon that is supported by a large body of scientific evidence obtained from many different investigations and observations. Experiment has been proven time and time again
8. cont. • A law or principle are facts of nature. • Ex. – an apple falls from a tree to the ground the law of gravity
Types of Data • Quantitative Data- are expressed as numbers. • Qualitative data: are descriptive and involve characteristics that usually cannot be counted.
Measurement Systems • A measurement must include a number and a unit • Science uses the metric system for all measurements – International system of units or SI units – this is used worldwide • In SI units, each type of measurement has a base unit • A standard, an exact quantity, is used for comparisons
SI Base Unit • Quality MeasuredUnitSymbol • Length meter m • Mass Kilograms kg • Time Seconds s • Electric Current ampere A • Temperature kelvin K • Amount of Substance mole mol
To use the metric system you must know the prefixes • The SI system is use because it is based on multiples of 10. • The prefix helps to determine what multiple of 10 to use • Kilo means 1000 so 1 Kilogram = 1000 grams • Deci means .1 (1/10) so 1 Decimeter= 1/10 of a meter or .1
To use the metric system you must know the prefixes • Base (meter,liter,gram) • Kilo k 1,000 • Hecto h 100 • Dekada 10 • Deci d .1 • Centi c .01 • Mili m .001
To use the metric system you must know the prefixes • Always remember this stair step method
How to convert units…. • A rope that measure 3,075 mm. How long is it in centimeters? • You Know: 1m = 10 dm = 100 cm= 1000mm • Questions: 3075mm = ? cm
To convert from a larger number to a smaller number, move the decimal to the right Ex. 5.32 m to cm Answer 532 cm To convert from a smaller number to a larger number, move the decimal to the left Ex. 7.5 cm to km Answer: .000075 km How to convert units….this is easier
Length • Length is the distance between two points • SI unit is meter (m) • Size of unit that is used will depend on what is being measured • It is easier to measure distance in kilometers than in meters.
Mass • Measurement of matter in an object • SI unit is a kilogram (kg) • A gram is such a small unit that it is only used to measure small masses • Measured on a balance
Time • Time is the interval between two events • SI unit is the second (s)
Temperature • For scientific work Temp. is measured in Celsius (oC) • Freezing point is 0oC and boiling is 100oC • SI unit is Kelvin (K) • Zero Kelvin is coldest possible point..That is equal to - 273o C)
Volume • Volume is the amount of space occupied by an object • Solid object – measure length, width, & height – multiply all three together and units will be cubed (ex: cm3 ) • Liquid – use ml • The conversion is 1mL = 1cm3
Density • Density is mass per unit of volume • D = m/v • Use a derived unit – a unit obtained by combining SI units • Example: mass is 10g and volume is 2cm3 • Answer: 5 g/cm3
SI Units • REMEMBER…any time you are measuring ALWAYS try to get at least one decimal place PASSED the unit used on device! • Ex: 3.5 m or cm…not just 3 or not 3 ½ m…or it could even be 3.52 • ALWAYS-give units…every time! • Lets practice…with a partner look at a ruler, meter stick, graduated cylinder, and a thermometer. How would you record the measurement?
How to Construct a Graph! • 1 Identify the variables • Independent Variable - (controlled by the experimenter) • Goes on the X axis (horizontal). Time is almost ALWAYS the independent variable. Time doesn't depend on anything in most experiments. But many things depend on it. This would be on the bottom section of a standard graph. • Dependent Variable - (changes with the independent variable) • Goes on the Y axis (vertical) These are usually on the right side of the graph.
How to Construct a Graph! • 2. Determine the variable range. • Subtract the lowest data value from the highest data value. • Do each variable separately. • 3. Determine the scale of the graph. • Determine a scale (the numerical value for each square) that best fits the range of each variable. • Spread the graph to use MOST of the available space. • 4. Number and label each axis. • This tells what data the lines on your graph represent. • 5. Plot the data points. • Plot each data value on the graph with a dot.
How to Construct a Graph! • 6. Draw the graph. • Draw a curve or a line that best fits the data points • Most graphs of experimental data are not drawn as "connect-the-dots". • However, occasionally we will do some that are connect the dots..but we hope to see these represent a CURVE! • 7. Title the graph. • Your title should clearly tell what the graph is about. This does NOT need to be a full sentence long! • If your graph has more than one set of data, provide a "key" to identify the different lines.
Inference • An inference is a logical interpretation based on prior knowledge or experience. • Ex: When testing a large body of water, you take samples to test and them infer your results to the entire body of water!
Inference…Line of Best Fit The 'line of best fit' goes roughly through the middle of all the scatter points on a graph. The closer the points are to the line of best fit the stronger the correlation is
Circle (Pie) Graph • A circle graph shows percentages of a whole
Line Graph • A line graph shows trends of how data changes over time
Bar Graph • A bar graph is used to compare information collected by counting
Lab Reports • Any time you perform an “official” experiment you will be required to write a lab report! • The style of this report may vary from teacher to teacher… but the basics will remain the same. You must accurately follow the steps of the scientific method, be able to explain all parts of your experiment, show numerical data, and state all findings. • This must be done using complete sentences, accurate grammar, and done neatly.