Download
1 / 66
790 likes | 2.77k Vues
Decision Theory Introduction What makes the difference between good and bad decisions? Good decisions may be defined as: Based on logic, Considered all possible decision alternatives, Examined all available information about future, and Applied decision modeling approach.

E N D
Introduction • What makes the difference between good and bad decisions? • Good decisions may be defined as: • Based on logic, • Considered all possible decision alternatives, • Examined all available information about future, and • Applied decision modeling approach. • Bad decisions may be defined as: • Not based on logic, • Did not use all available information, • Did not consider all alternatives, and • Did not employ appropriate decision modeling techniques.
Decision Analysis Aset of quantitative decision-making techniques for decision situations where uncertainty exists
Decision Theory Elements • A set of possible future conditions exists that will have a bearing on the results of the decision • A list of alternatives (courses of action) for the manager to choose from • A known payoff for each alternative under each possible future condition
Decision Making States of nature • Events that may occur in the future • Decision maker is uncertain which state of nature will occur • Decision maker has no control over the states of nature
location planning capacity planning equipment selection Decision Theory Decision Theoryrepresents a general approach to decision making which is suitable for a wide range of operations management decisions, including: product andservice design
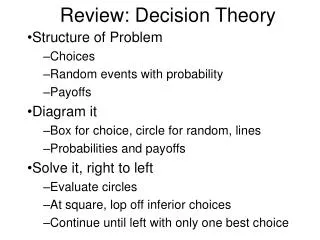
Five Steps of Decision Making • 1. Clearly define the problem at hand. • 2. List all possible decision alternatives. • 3. Identify possible future events (states of nature) • 4. Identify payoff (usually, profit or cost) for each • combination of alternatives and events. • 5. Select one of the decision theory modeling techniques, apply decision model, and make decision.
Thompson Lumber Company (1 of 2) • Step 1. Identifies problem as: • whether to expand product line by manufacturing and marketing new product which is “backyard storage sheds.” • Step 2. Generate decision alternatives available. • Decision alternative is defined as course of action or strategy that may be chosen by the decision maker. Alternatives are to construct: • (1) a large plant to manufacture storage sheds, • (2) a small plant to manufacture storage sheds, or • (3) build no plant at all. • Step 3. Identify possible future events
Thompson Lumber Company(2 of 2) • Step 4. Express payoff resulting from each possible combination of alternatives and events. • Objective is to maximize profits. • Step 5. Select decision theory model and apply it to data to help make decision. • Type of decision model available depends on the operating environment and the amount of uncertainty and risk involved.
Payoff Table • A method of organizing & illustrating the payoffs from different decisions given various states of nature • A payoff is the outcome of the decision
Payoff Tables • Payoff Tables can be constructed when there is a finite set of discrete decision alternatives. • In a Payoff Table - • The rows correspond to the possible decision alternatives. • The columns correspond to the possible future events. • Events (States of Nature) are mutually exclusive • The body of the table contains the payoffs.
Payoff Table States of Nature Decision a b 1 Payoff 1a Payoff 1b 2 Payoff 2a Payoff 2b
Types Of Decision Making Environments Type 1: Decision Making under Certainty Type 2: Decision Making under Uncertainty Type 3: Decision Making under Risk.
Types Of Decision Making Environments • Type 1: Decision Making under Certainty. Decision maker knows with certainty the consequence of every decision alternative. (The future state of nature is assumed to be known.) • Type 2: Decision Making under Uncertainty. Decision maker has no information about various outcomes. (There is no knowledge about the probability of the states of nature occurring)
Types Of Decision Making Environments Type 3: Decision Making under Risk. Decision maker has some knowledge regarding the probability of occurrence of each event or state of nature. (There is some knowledge about the probability of the states of nature occurring)
Decision Making Under Uncertainty- Steps of : • Construct a Payoff Table • Select a Decision Making Criterion • Apply the Criterion to the Payoff Table • Identify the Optimal Solution
Decision Making Under Uncertainty • The decison criteria are based on the decision maker’s attitude toward life • These include an individual being pessimistic or optimistic, conservative or aggressive
Decision Making Criteria Under Uncertainty • Criteria for making decisions under uncertainty. • Maximax. • Maximin • Equally likely. • Criterion of realism. • Minimax regret. • First four criteria calculated directly from decision payoff table. • Fifth minimax regret criterion requires use of opportunity loss table.
Maximax Criterion (1 of 2) • Maximax criterion selects the alternative that maximizes maximum payoff over all alternatives. • Is based on the best possible scenario. • First locate maximum payoff for each alternative. • Select alternative with maximum value. • Decision criterion locates alternative with highest possible gain. • Called optimistic criterion. • Table shows maximax choice is first alternative: "construct large plant."
Maximax Criterion (2 of 2) Example 1: Thompson Lumber Company • Maximax criterion selects alternative that maximizesmaximum payoff over all alternatives. • First alternative, "construct a large plant”, $200,000 payoff is maximum of maximum payoffs for each decision alternative.
Maximin Criterion (1 of 2) • Maximin criterion finds the alternative that maximizes minimum payoff over all alternatives. • Is based on the worst-case scenario. • First locate minimum payoff for each decision alternative across all states of nature. • Select the alternative with the maximum value. • Decision criterion locates the alternative that has the least possible loss. • Called pessimistic criterion. • Maximin choice, "do nothing," is shown in table. • $0 payoff is maximum of minimum payoffs for each alternative.
Maximin Criterion (2 of 2) Example 1. Thompson Lumber Company • First locate minimum payoff for each alternative, and select the alternative with maximum number.
Equally Likely (Laplace) Criterion (1 of 2) • Equally likely, also called Laplace, criterion finds decision alternative with highest average payoff (here the probabilities of each state of nature is assumed to be equal) • Calculate average payoff for every alternative. • Pick the alternative with maximum average payoff. • Assumes all probabilities of occurrence for states of nature are equal. • Equally likely choice is the second alternative, "construct a small plant." • Strategy shown in table has maximum average payoff ($40,000) over all alternatives.
Equally Likely (Laplace) Criterion (2 of 2) Example 1. Thompson Lumber Company • Equally likely criterion finds decision alternative with highest average payoff. • Calculate average payoff for every alternative. • Pick alternative with maximum average payoff.
Criterion of Realism (Hurwicz)(1 of 3) • Often called weighted average, the criterion of realism (or Hurwicz) decision criterion is a compromise between optimistic and pessimisticdecision. • Select coefficient of realism, a, with value between 0 and 1. • When a is close to 1, decision maker is optimistic about future. • When a is close to 0, decision maker is pessimistic about future.
Criterion of Realism (2 of 3) • Formula for criterion of realism = • a (maximum payoff for alternative) + • (1-a) (minimum payoff for alternative) • Assume coefficient of realism a = 0.80. • Best decision would be to construct a large plant. • This alternative has highest weighted average payoff: $124,000
Criterion of Realism (3 of 3) Example 1. Thompson Lumber Company • Coefficient of realism a = 0.80. • $124,000 = (0.80)($200,000) + (0.20)(- $180,000).
Minimax Regret Criterion (1 of 5) • Final decision criterion is based on opportunity loss. • Develop opportunity loss (regret) table. • Determine opportunity loss of not choosing the best alternative for each state of nature (or the regret by failing to choose the “best” decision)
Minimax Regret Criterion (2 of 5) • Opportunity loss, also called regret for any state of nature, or any column is calculated by subtracting each outcome in column from best outcome in the same column. • The alternative with the minimum of the maximum regrets for each alternative is selected.
Minimax Regret Criterion(3 of 5) Example 1. Thompson Lumber Company • Best outcome for favorable market is $200,000 as result of first alternative, "construct a large plant." • Subtract all payoffs in column from $200,000. • Best outcome for unfavorable market is $0 thatis the result of third alternative, "do nothing." • Subtract all payoffs in column from $0. • Table illustrates computations and shows complete opportunity loss table.
Minimax Regret Criterion(4 of 5) Example 1. Thompson Lumber Company • Table illustrates computations and shows complete opportunity loss table.
Minimax Regret Criterion(5 of 5) Example 1. Thompson Lumber Company • Once the opportunity loss table has been constructed, locate the maximum opportunity loss within each alternative. • Pick the alternative with minimum value • Minimax regret choice is second alternative, "construct a small plant." Regret of $100,000 is minimum of maximum regrets over all alternatives.
Tom Brown Investment Example for Decision Making Under Uncertainty
Example 2. Tom Brown Investment Decision • Tom Brown has inherited $1000. • He has decided to invest the money for one year. • A broker has suggested five potential investments. • Gold. • Junk Bond. • Growth Stock. • Certificate of Deposit. • Stock Option Hedge. • Tom has to decide how much to invest in each investment.
The Payoff Table Example 2. Tom Brown Investment Decision The Stock Option Alternative is dominated by the Bond Alternative
The Optimal decision Maximax Criterion Example 2. Tom Brown Investment Decision
The Optimal decision The Maximin Criterion Example 2. Tom Brown Investment Decision
The Optimal decision Minimax Regret Criterion Example 2. Tom Brown Investment Decision Regret Table
Decision Making Under Risk • Common for decision maker to have some idea about the probabilities of occurrence of different outcomes or states of nature. • Probabilities may be based on decision maker’s personal opinions about future events, or on data obtained from market surveys, expert opinions, etc. • When probability of occurrence of each state of nature can be assessed, problem environment is called decision making under risk.
Expected Monetary Value (1 of 3) • Given decision table with conditional values (payoffs) and probability assessments, determine the expected monetary value (EMV) for each alternative. • Computed as weighted average of all possible payoffs for each alternative, where weights are probabilities of different states of nature: • EMV (alternative i) = • (payoff of first state of nature) x (probability of first • state of nature) + • (payoff of second state of nature) x (probability of second • state of nature) + . . . + • (payoff of last state of nature) x (probability of last • state of nature)
Expected Monetary Value (2 of 3) Example 1. Thompson Lumber Company • Probability of favorable market is the same as probability of unfavorable market. • Each state of nature has a 0.50 probability of occurrence.
The Optimal decision Expected Monetary Value (3 of 3) Example 2. Tom Brown Problem (0.2)(250) + (0.3)(200) + (0.3)(150) + (0.1)(-100) + (0.1)(-150) = 130
Expected Value of Perfect Information Expected value of perfect information:the difference between the expected payoff under certainty and the expected payoff under risk Expected value ofperfect information Expected payoffunder certainty Expected payoffunder risk - =
Expected Value of Perfect Information • Expected value with perfect information is expected or average return, if one has perfect information before decision has to be made. • Choose best alternative for each state of nature and multiply its payoff times probability of occurrence of that state of nature: • Expected value with perfect information (EV with PI) = • (best payoff for first state of nature)x • (probability of first state of nature) • + (best payoff for second state of nature) • x (probability of second state of nature) • + . . . + (best payoff for last state of nature) • x (probability of last state of nature) • EVPI = EV with PI - maximum EMV • It is also the smallest expected regret of any decision alternative.
EV with PI and EVPI • Best outcome for state of nature "favorable market" is "build a large plant" with a payoff of $200,000. • Best outcome for state of nature "unfavorable market" is "do nothing," with payoff of $0. • Expected value with perfect information • (EV with PI) = ($200,000)(0.50) + ($0)(0.50) • = $ 100,000. • If one had perfect information, an average payoff of $100,000 if decision could be repeated many times. • Maximum EMV or expected value without perfect information, is $40,000. • EVPI = EV with PI - maximum EMV • = $100,000 - $40,000 = $60,000.
Decision Trees • Any problem presented in decision table can be graphically illustrated in decision tree. • A graphical method for analyzing decision situations that require a sequence of decisions over time (decision situations that cannot be handled by decision tables) • Decision tree consists of • Square nodes - indicating decision points • Circles nodes - indicating states of nature • Arcs - connecting nodes
These nodes are represented using following symbols: • = A decision node • Arcs (lines) originating from decision node denote all decision alternatives available at that node. • О = A state of nature (or chance) node. • Arcs (lines) originating from a chance node denote all states of nature that could occur at that node.