Download
1 / 24
290 likes | 542 Vues
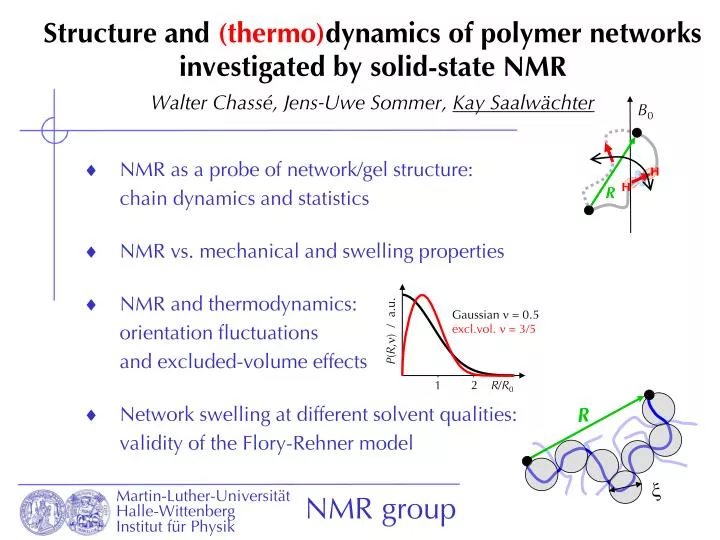
B 0. H. H. R. Gaussian n = 0.5. excl.vol. n = 3/5. P ( R , n ) / a.u. 2. R / R 0. 1. Structure and (thermo) dynamics of polymer networks investigated by solid-state NMR Walter Chassé, Jens-Uwe Sommer, Kay Saalwächter.

E N D
B0 H H R Gaussian n = 0.5 excl.vol. n = 3/5 P(R,n) / a.u. 2 R/R0 1 Structure and (thermo)dynamics of polymer networks investigated by solid-state NMR Walter Chassé, Jens-Uwe Sommer, Kay Saalwächter • NMR as a probe of network/gel structure:chain dynamics and statistics • NMR vs. mechanical and swelling properties • NMR and thermodynamics: orientation fluctuations and excluded-volume effects • Network swelling at different solvent qualities:validity of the Flory-Rehner model R x
dynamic chain order parameter b(t) « n « Þ S ( n ) Not quite a liquid… NMR in entangled melts and networks, swollen or above Tg:
free induction decay coupling …encoded in time-domain signal decay acquisition time HO–CH2–CH3 Fourier transformation frequency spectrum inhom. low field: • no spectral resolution • coupling: additional broadening NMR: time-domain signal, spectrum, and coupling N spin S
Dstat »30 kHz (!) powder average (all b) q ± wD(b2) ± wD(b1) b2 freq. w b1 Dres»100 Hz fast-motion limit (rubber T >> Tg): wD ~ á P2(cos b) ñt ´ P2(cos q) powder average (all q) R dyn. order parameter S = Dres/Dstat = 3/(5N) freq. w • S and its distribution can be measured by time-domain (MQ) NMR • also accessible: isotropic fraction = sol, network defects chain ends KS, Prog. Nucl. Magn. Reson. Spetrosc.51 (2007), 1 Dipole-dipole coupling and chain dynamics/statistics B0 static limit (glass): wD ~P2(cos b)/rHH3 H H network chain, N segments
different cure systems: Conventional: accelerator/sulphur (0.2/1) mobile impurities Efficient: accelerator/sulphur (12/1) Peroxide: dicumyl peroxide loops dangling ends sol Inhomogeneities in rubbers: defects SMQ DQ tDQ J. López Valentín, P. Posadas, A. Fernández-Torres, M. A. Malmierca, L. González, W. Chassé, KS, Macromolecules43 (2010) 4210.
“zipping” reaction: R· n n n … Inhomogeneities in natural rubber nDQ= DQ/(SMQ-tail) 0.5 initial slope reflects crosslink density (~ Dres ) and its distribution tDQ J. López Valentín, P. Posadas, A. Fernández-Torres, M. A. Malmierca, L. González, W. Chassé, KS, Macromolecules43 (2010) 4210.
Bruker minispec mq20, 0.5 T cheap NMR! (~ € 75.000.-) KS, J. Am. Chem. Soc. 125(2003), 14684 Model-heterogeneous networks x-link density distributions in end-linked PDMS model networks .008 100% PDMS precursors: long chains: 47k short chains: 0.8k 90% .006 70% 50% relative amplitude .004 30% % short chains 20% .002 10% 0% 0 0 400 800 1200 1600 NMR crosslink density Dres (~ S ~ 1/N) / Hz KS, J.-U. Sommer, et al., J. Chem. Phys.119 (2003), 3468 W. Chassé, J. López-Valentín, G.D. Genesky, C. Cohen, KS, J. Chem. Phys. 134 (2011) 044907
swelling equilibrium: d(Felastic + Fosmotic)=0 eq. degree of swelling: Qeq = 1/fr = V/V0 =f(1/Mc) mechanical and NMR properties: 1/Mc µ n µGµDres Swelling of elastomers
Me tube model entanglement effects: Mooney-Rivlin analysis Mechanics of elastomers natural rubber samples in uniaxial deformation G ~ 1/Mc ~ n sulfur content A. Vieyres, R. Pérez-Aparicio, P.-A. Albouy, O. Sanseau, KS, D.R. Long, P. Sotta, Macromolecules46 (2013) asap.
1/Mte 1/Me ~ C2 1/Me mechanics X-link density from NMR vs. swelling and mechanics 1/Me (?) swelling A. Vieyres, R. Pérez-Aparicio, P.-A. Albouy, O. Sanseau, KS, D.R. Long, P. Sotta, Macromolecules46 (2013) asap.
bond-fluctuation Monte-Carlo simulations of a monomodal network (N = 25): 40 » Q = 1 ( S 0.06) b Q = 1 Q = 5.0 1.24 30 1.59 1.88 rel. weight / a.u. rel. weight 2.55 20 2.92 10 network chain density by BFM 0 0.00 0.05 0.10 0.15 0.20 0.00 0.10 0.20 0.30 0.40 chain order parameterS backbone order parameter S more general reasons for sub-affine behavior of most probable and average S? J.-U. Sommer, KS, Eur. Phys. J. E 18 (2005) 167-182 Swollen networks are inhomogeneous now: NMR study in the below-equilibrium swollen state experimental results for a monomodal PDMS network (5.2k, N = 19): KS, F. Kleinschmidt, J.-U. Sommer, Macromolecules37 (2004) 8556
L unfolding link between leaves desinter- spersion affine fits affine range (universal) bulk crosslink/ constraint density entanglement/packing contribution phantom reference state Two-stage swelling process distribution-averaged segmental order note: affine prediction Dres ~ S ~ (R2/R02) ~ Q3/2 0.25 ePDMS-21 t200 IR-06 0.20 segmental orientation correlation S ~ Dres/2p / kHz 0.15 0.10 0.05 1 2 3 4 5 6 7 swelling degree Q= V/V0 J.P. Cohen-Addad, M.. Domard, G. Lorentz, J. Herz, J. Phys. France45 (1984) 575–586. W. Chassé, S. Schlögl, G. Riess, KS, Soft Matter 2013, submitted.
0.4 D D res res,n IR 0.3 NR lin. fits average Dres/2p / kHz 0.2 0.1 0.0 0.4 0.3 0.2 0.1 0.0 0.00 0.02 0.04 0.06 0.08 0.10 0.12 0.14 0.16 0.18 Phantom reference network plus entanglements entanglement/packing contribution consistent with Mooney-Rivlin C2? vulcanized NR/IR rubbers different PDMS networks slope=1.04±0.03 average Dres/2p / kHz D D res res,n ePDMS-21 ePDMS-25R rPDMS xPDMS 1/ from equilibrium swelling / mol/kg M c,app W. Chassé, S. Schlögl, G. Riess, KS, Soft Matter 2013, submitted.
1.7 1.6 1.5 1.4 1.3 1.2 effect of excluded volume! 1.1 1 0.9 styrene (q) 0.8 1 2 3 1 2 3 4 5 1 2 3 4 5 6 7 S and thermodynamics: experimental indications PDMS networks, partially swollen in good and q solvents j =1.00 j =0.31 j =0.18 p,c p,c p,c reduced coupling Dres(Q)/Dres(Q=1) toluene (good) degree of swelling Q = V/V0 W. Chassé, S. Schlögl, G. Riess, KS, Soft Matter 2013, submitted.
b self-similarity arguments: • S is (almost) not dependent on position in chain • use general P(R,n) Gaussian n = 0.5 excl.vol. n = 3/5 P(R,n) / a.u. stretching ratio (relevant for swelling!) 2 R/R0 1 S and thermodynamics: theory where S is proportional to the square of the orienting entropic forceFn= F/kT = 3R/R02on a segment • depends on chain conformation statistics P(R’) R R’ J.-U. Sommer, W. Chassé, J. López-Valentín, KS, Phys. Rev. E78 (2008) 051803
S and thermodynamics: proof by simulation Bond-fluctuation Monte-Carlo simulations of single chains with fixed ends and excluded-volume interaction predicted exponent/slope: 2n(1-n) = 2.85 (>> 2 for Gaussian limit) • S is reduced in good solvent! J.-U. Sommer, W. Chassé, J. López-Valentín, KS, Phys. Rev. E78 (2008) 051803
same result for both models! Seq = Qeq-2n/(3n-1) ~1/x2 theor. (n = 0.6): slope = -1.5 • simple experimental test! • NMR measures blob size! (what does this imply?) Swelling in good solvent: semi-dilute state use scaling arguments (Gaussian string of blobs, excluded volume only inside blob) to predict Seq check two approaches: • c* model (de Gennes): Qeq = Q* ~ N3n-1 • affine model (Flory-Rehner): Qeq = (Req2/Nb2)3/2 R x blob size J.-U. Sommer, W. Chassé, J. López-Valentín, KS, Phys. Rev. E78 (2008) 051803
toluene • test on 10 different solution and bulk, end- and randomly-linkedPDMS networks ethyl acetate 10 n-butanone no good! styrene 8 phenetole 1-propanol 8 ePDMS-21 t700 ePDMS-25R t400 6 7 ePDMS-21 t700 ePDMS-25R t100 6 4 ePDMS-21 t200 rPDMS-431 c060 5 eq. degree of swelling Qeq = Veq/V0 ePDMS-21 t020 eq. degree of swelling Qeq = Veq/V0 2 rPDMS-731 c075 4 0 • get effective qvia mastering • determine B and n´gf via fitting 3 -0.6 -0.4 -0.2 0.0 0.2 0.4 2 good poor q 1 260 280 300 320 340 360 temperature T / K reduced temperature (1-q/T) Testing F.-R.: swelling in solvents of different quality Flory-Rehner equation with fr = V0/V = 1/Qeq: effective interaction parameter: W. Chassé, J.-U. Sommer, KS, Macromolecules 45 (2012) 5513
apparent q temperatures are dependent on crosslink density fits to swelling master curve (excluding good-solvent region) • trends extrapolate back to q of linear-chain solutions • but: large deviation for good solvent! • good correlation of crosslink densities by NMR vs. swelling • B varies only weakly with crosslink density (B» 2.4) 5 550 4 500 1-propanol 3 450 phenetole 0.20 styrene B 400 butanone 2 ´ n g f 350 0.16 ethyl acetate toluene 300 1 0.12 q from mastering / K effective crosslink density n´gf 250 parameter 0 0.08 200 B 150 0.04 0.0 0.1 0.2 0.3 0.4 0.5 0.6 0.7 0.8 0.00 0.0 0.1 0.2 0.3 0.4 0.5 0.6 0.7 0.8 bulk NMR-based crosslink density (Dres/2p / kHz) bulk NMR-based crosslink density (Dres/2p / kHz) Testing F.-R.:swelling in solvents of different quality F.R. works well for q and poor solvents W. Chassé, J.-U. Sommer, KS, Macromolecules 45 (2012) 5513
dependence on crosslink density (once again) demonstrated • dependence could indirectly relate to concentration (1/Qeq) • further apparent (but not serious) limitations of F.-R.: • mean-field theory, no proper equation of state • high concentrations (low swelling) require higher-order virials • free-energy additivity assumption • possible additional entropy gain by “desinterspersion” Testing F.-R.: constant or variable c parameter? use thermodynamic results (q,B) to calculate apparent c = ½ -B(1-q/T) 2.0 1.5 1.0 c parameter at 293 K 1-propanol 0.5 phenetole butanone 0.0 ethyl acrylate toluene -0.5 0.0 0.1 0.2 0.3 0.4 0.5 0.6 0.7 0.8 bulk NMR-based crosslink density (Dres/2p / kHz) W. Chassé, J.-U. Sommer, KS, Macromolecules 45 (2012) 5513
joint fit with prediction based upon Gaussian statistics throughout,use q = 308 K (solution value), result: B = 2.4 (consistent!) • scaling exponent Seq ~ Qeq-xfaithfully reflects solvent quality! 0 0.1 -2 fit not possible in good-solvent range effective exponent x Seq -4 253 K 263 K 273 K 283 K 293 K 303 K 308 K 313 K 323 K 333 K 343 K slope -2 good-solvent limit PDMS/styrene PDMS/toluene Flory-Rehner -6 -8 good solvent: F.-R. requires proper scaling treatment 0.01 -0.4 -0.2 0 0.2 0.4 -2 reduced temperature (1 - q / T) 1 10 Qeq Testing F.-R.: S from NMR at swelling equilibrum remember: Seq ~ Qeq-1.5 in good solvent, predicted by F.-R. + scaling test many PDMS networks in styrene, vary c via temperature change W. Chassé, J.-U. Sommer, KS, Macromolecules 45 (2012) 5513
concentration blob = Pincus (force) blob the string of blobs is fully stretched! Why is corrected F.-R. equivalent to the c* model? remember: Seq ~ Qeq-1.5 is predicted by both models NMR-detected segmental orientation fluctuation q • interpretation: • elastic free energy at Qeq (kT per chain) arises from stretching of N/g blobs • no orientation fluctuations beyond the size of a blob • NMR measures blob size! • no stretching of R in early-stage swelling, desinterspersion is an issue W. Chassé, J.-U. Sommer, KS, Macromolecules 45 (2012) 5513
entanglements add a • constant contribution • to n • validity region of Gaussian statistics further increased! Te ne Is the q condition observable in a network? • define “network temperature” Tn = q(1 + Cn3/8) • (derivation based upon appearance of blobs in good solvent, • beyond which excluded-volume effects are screened) • crosslinks limit the blob size • poor-good crossover occurs at higher temperature, q for linear solution is no longer visible/relevant Tn good solvent q poor solvent crosslink density n W. Chassé, J.-U. Sommer, KS, Macromolecules 45 (2012) 5513
W. Chassé, J.-U. Sommer, KS, Macromolecules 45 (2012) 5513 • … and thermodynamics! • excluded volume affects fluctuation statistics • note analogy to scattering: thermodynamics from concentration fluctuations • Flory-Rehner theory is not valid for swelling in good solvent • NMR results show clearly: good solvents require refined treatment of chain statistics (excluded-volume screening) • poor and q solvents: F.-R. qualitatively applicable, detail problems • signature of q of lin. solution (not surprisingly) lost • desinterspersion effects important €€€: Jens-Uwe Sommer Walter Chassé Conclusions • NMR-determined orientation fluctuations probe network structure…