Download
1 / 20
200 likes | 333 Vues
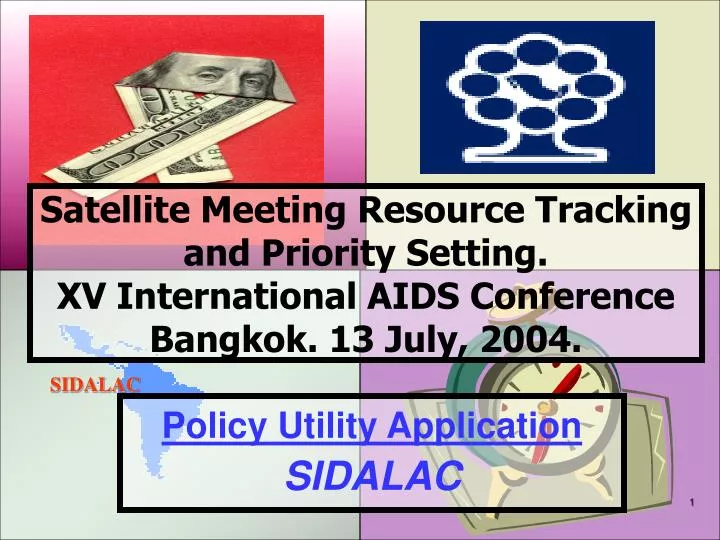
Satellite Meeting Resource Tracking and Priority Setting. XV International AIDS Conference Bangkok. 13 July, 2004. Policy Utility Application SIDALAC. Detail by subprograms. Access to ARV Vertical Prevention Blood Banks IDU Prevention. Prevention of Sexual Transmission.

E N D
Satellite Meeting Resource Tracking and Priority Setting.XV International AIDS Conference Bangkok. 13 July, 2004. Policy Utility Application SIDALAC
Detail by subprograms • Access to ARV • Vertical Prevention • Blood Banks • IDU Prevention
Prevention of Sexual Transmission. • Identification of the expenditure explicitly directed to the most vulnerable populations and the highest risk for HIV • MSM • CSW (men and women) • General Population (youngsters, women) • Social marketing of condoms • Inmates • Mobile Populations
Categories of Expenditure(examples) • Public Health: Epi Surveillance, IEC • Prevention: Condoms, STI’s Tx, MTCT Prevention, Needles, Blood Banks • Treatment: Hospitalary, Ambulatory • Support Services: Diagnostic Tests, Monitoring of ARV therapy –viral load, CD4+ Cell counts. • Anti-retrovirals • Other drugs: Prophylaxis, Treatment of OI
Ghana Burkina Faso Honduras Uruguay Argentina Q4 Costa Rica Nicaragua Panamá Q3 Brasil Perú R Dominicana Q2 El Salvador Paraguay Chile México Q1 Guatemala Bolivia 0.00 2.00 4.00 6.00 8.00 10.00 12.00 Honduras HIV/AIDS Prevalence = 1.79%; Burkina Faso = 4% ; Ghana = 3.4% African countries provide very limited coverage of ARV. Total HIV/AIDS Expenditures LAC and Two West African countries. Adjusted by PPP-USD$, 2002.
Expenditure in Functions by Source in 13 LAC countries, 2002. Total expenditure = USD$ 588,550,000
Expenditure in Functions by Source in West African countries, 2003. Total expenditure = USD$ 51,858,000
65% Antirretrovirals 12% Hospitalary care 7% Other drugs 5% Ambulatory 5% Diagnostic Tests Monitoring of PLWA 3% Other non-durable goods Other goods and Services 100 200 300 400 500 600 Expenditure in Care and treatment for HIV/AIDS, LAC. (million dollars) Total Expenditure on Care US$ 800,845,217 Expenditure per capita $1.65
58% Condoms 16% IEC 13% Blood Banks 7% STI Dx & Tx 2.5% MTCP Epidemiological Surveillance 2.5% 1% Needle Exchange Programs - 20 40 60 80 100 120 140 160 180 200 Public Health and Prevention Expenditure in LAC (Million US Dollars) Total Expenditure in Prevention and Public Health US$ 309,221,436 Total per capita $0.64
Training 72% Research and Development 10% Monetary benefits to PLWA 8% 7% Empowerment In Kind benefits to PLWA 2% Advocacy 1% - 5 10 15 20 25 30 Expenditure on Non-Health Actions in LAC (million dollars) Total Non-Health Expenditure US$37,582,037 Multisectoral does not necessarily means non-health
Total HIV/AIDS Expenditures by Functions, Burkina Faso, 2003 ONUSIDA Non - Health or health related expenditures FUNSALUD Personal Health 23% Care services 26% SIDALAC SIDALAC Equipment 2% Administration 15% Prevention and Public Health 34%
HIV/AIDS Expenditures by source and by target population. Belize, 2003.
México Panama Brazil Q4 Guatemala Costa Rica Argentina Q3 Chile El Salvador Dominican R Q2 Nicaragua Uruguay Paraguay Honduras Q1 Peru Bolivia 0.00% 10.00% 20.00% 30.00% 40.00% 50.00% 60.00% 70.00% 80.00% 90.00% Public Expenditures in HIV/AIDS as Percentage of National HIV/AIDS Expenditures in LAC
1000 812 800 600 415 USD$ 352 400 248 157 200 68 45 42 0 1997 1998 1999 2000 YEAR Prevention Treatment and care Expenditure in Prevention and Care. BRAZIL 1997-2000 (million $USD) A saving in care; an increase in prevention
155 160 140 128 Prevention Care 114 120 100 82 82 80 60 49 50 42 43 44 41 36 34 30 40 20 0 1995 1996 1997 1998 1999 2000 2001 2002 HIV/AIDS Expenditures in prevention and care. MEXICO 1995-2002. (Million USD$) Sharper increase in care; moderate increase for prevention.
Preventive expenditure on MSM and percentage of AIDS cases among MSM Lack of correlation between epidemiogical information and expenditure in the population at highest risk % 70.0 60.0 50.0 40.0 30.0 20.0 10.0 0.0 Peru Chile Brazil Bolivia Mexico Costa Rica Uruguay Panama Argentina Paraguay El Salvador Dominican R Guatemala Preventive Expenditure on MSM AIDS Cases among MSM
HIV/AIDS Expenditures in Local Currency. Ghana, 2002-2003 Additionality of GFATM resources. 100,000 80,000 60,000 CEDIS 40,000 20,000 0 NGO’s Households (OOPE) Ministry of Health Bilaterals Multilaterals (Including GFATM) International NGOs Other Central Government 2002 2003 PUBLIC PRIVATE INTERNATIONAL
Functional Group of Expenditures, Belize 1999-2002. (Bz$ Thousands) Increase in non-health Activities, mainly because the result of UNTG
Expenditures on HIV/AIDS by Source of Funds, Belize 1999-2002. (Bz$ Thousands) Increase in non-health Activities, mainly because the result of UNTG