Download
1 / 17
180 likes | 361 Vues
Causes of Upstream Wetland Loss on the Dead Zone in the Gulf of Mexico. Jonathan Burnett Jackie Comisso Travis Borrillo-Hutter Terra Michaels. Mississippi River Basin . Third largest river in the world.

E N D
Causes of Upstream Wetland Loss on the Dead Zone in the Gulf of Mexico Jonathan Burnett Jackie Comisso Travis Borrillo-Hutter Terra Michaels
Mississippi River Basin Third largest river in the world. Drains over 3,200,000 km2 of freshwater, sediments, and nutrients to the Gulf of Mexico One of the most productive agricultural regions in the country
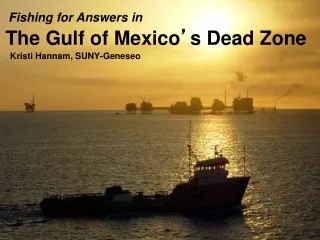
What are Dead Zones? • “Dead Zone” or otherwise known as “eutrophication”. Process involving removal of oxygen from water bodies • Two Causes: Natural and Anthropogenic. • Main difference is anthropogenic eutrophication occurs much more rapidly.
The Problem Non-point source pollution Point source pollution • Pollution that arise from many dispersed areas and it is not traceable to any single discrete source (e.g., cars leaking oil, excess fertilizers in farms) • Pollutants discharged from a single identifiable location (e.g., pipes, ditches, channels, sewers, tunnels)
Sources Natural Anthropogenic • Stratification of fresh water over salt water. • Warming ocean waters. • Increased concentrations of CO2 in ocean. • Agriculture and Municipal are main human sources • Rapidly stimulates phytoplankton growth. • The natural decomposition of phytoplankton depletes O2 from Gulf.
Main Pollutants Nitrogen Phosphorous • Nitrates (fertilizers containing NO3- ) are highly water soluble,. • Only 18% applied N is taken up by produce. • Fertilizers make up 70 percent of the N in Gulf. • Nitrogen delivered to Gulf has tripled in the last 4 decades. • Not water soluble, moves only with soil movement. • Erodes on soils from agricultural fields, where it is non-recoverable. • Net P storage in soil and fresh water ecosystems is 75% higher than preindustrial times
Municipal • Nitrogen and Phosphorus are still main pollutants • Other contaminants include organic pollutants, pharmaceuticals, and heavy metals • EPA does not require testing for organic pollutants in sewage • 1.2 billion gallons sewage from Baton Rouge each year • 100 million gallons from Baltimore
Nitrate-nitrogen concentrations (average±S.E.) in Olentangy River, Ohio and Mississippi River, Louisiana. Data for Olentangy River in Columbus are based on 8 years of weekly sampling; data from Mississippi River are based on 7 years of monthly sampling at Caernarvon, Louisiana.
Wetland – Biological Supermarkets • Produce great quantities of food • Development of organisms that form the base of the food web • Numerous species of birds and mammals rely on wetlands for food, water, and shelter • Biogeochemical cycling • Wetlands can receive, store, and release water in various ways • physically through ground water and surface water • biologically through transpiration by vegetation
Wetlands • Wetlands provide the conditions needed for the removal of both nitrogen and phosphorus from surface water • Greatly influence the flow and quality of water. • Help improve water quality • Wetlands also reduce environmental problems
Options • Three general approaches for reducing agriculturally derived nitrogen that would otherwise reach the Gulf of Mexico • (1) Change farming practices • (2) Intercept laterally moving groundwater and surface water with nitrogen-sink ecosystems, particularly riparian zones and created and restored wetlands • (3) Provide a system of river diversion backwaters along rivers and in the Mississippi River
Case Studies Nutrient Removal By Wetland Systems In The Midwest
Wetlands nab nitrogen from waters flowing into Midwestern reservoir • Lake Bloomington serves as the drinking water source ~70,000 • 1986 through 2003, exceeded the maximum contaminant levels for ~86 percent of the lake’s watershed is used for corn and soybean agriculture • In 1997 scientists reconstructed natural wetlands near Lake Bloomington similar to those once existing in the greater midwestern United States • Reduced nitrate nearby agricultural lands by 31 to 42% • The report suggests that multi-million dollar investments in drinking water treatment plants in local watersheds could be mitigated if preserving or restoring wetlands alleviate contamination problems
Constructed wetlands lower nitrogen and phosphorus content of polluted water • In 1998, researchers at the Ohio State University created a wetland adjacent to a tributary stream flowing to the South Fork of the Great Miami River. • The Great Miami River flows into a lake, which then flows to the Ohio River and on to the Mississippi. • The wetland’s ability to remove nutrients increased with age. • In 1999 the wetland reduced nitrate-nitrite levels by an average of 30% and diminished total phosphorus pollution by an average of 37 percent. • In a subsequent analysis reported in 2005, the wetland “reduced levels of phosphorus by nearly 60 percent and nitrates by 40 percent.”
Dead Zone Growth Each year the Dead Zone grows the size of New Jersey (5,000 - 8,000 square miles ) The zone is 17-21 percent larger than 1985 From 1998 -2002 avg $270 million worth N fertilizer was flushed down the Mississippi River each spring. In 2007 the federal mandate set targets for U.S. to blend 36 billion gallons of biofuels a year into fuel supply.