Download
1 / 17
220 likes | 582 Vues
Graphing & Solving Quadratic Inequalities 5.7. What is different in the graphing process of an equality and an inequality? How can you check the x-intercepts of a quadratic equation or inequality? Why is it important to test 3 intervals after you have found the critical x values?.

E N D
Graphing & Solving Quadratic Inequalities 5.7 What is different in the graphing process of an equality and an inequality? How can you check the x-intercepts of a quadratic equation or inequality? Why is it important to test 3 intervals after you have found the critical x values?
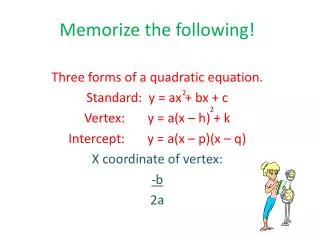
y > ax2 + bx + c y ≥ ax2 + bx + c y < ax2 + bx + c y ≤ ax2 + bx + c There are four types of quadratic inequalities in two variables.
y > x2 − 2x − 3 x = −b/2a= y =
Where to shade… • Test a point inside the parabola, such as (0, 0). • If you get a true statement when you substitute the point into the inequality, shade that area. • If you get a false statement when you substitute the point into the inequality, shade the opposite area.
Rappelling A manila rope used for rappelling down a cliff can safely support a weight W(in pounds) provided W ≤ 1480d 2 where dis the rope’s diameter (in inches). Graph the inequality. SOLUTION Graph W = 1480d 2 for nonnegative values of d. Because the inequality symbol is ≤, make the parabola solid. Test a point inside the parabola, such as (1, 2000).
2000 ≤ 1480 Rappelling continued W≤ 1480d 2 2000≤ 1480(1)2 Because (1, 2000) is not a solution, shade the region below the parabola.
Solving a Quadratic Inequality by Graphing (Looking for x intercepts) x2 − 6x + 5 < 0. Let y = 0 and factor to solve. (x−1)(x−5) = 0x = 1 or x = 5 Solution 1<x<5
Solving a Quadratic Inequality by Graphing 2x2 + 3x− 3 ≥ 0 (Use quadratic formula to factor.) 0.69 or −2.19
Graphing a System of Quadratic Inequalitiesy ≥ x2 −4y< −x2 −x +2 x = −b/2a = y= x=−b/2a = y=
Graph the system of quadratic inequalities. y < – x2 + 4 Inequality 1 y > x2 – 2x – 3 Inequality 2 SOLUTION STEP 1 Graph y ≤ –x2 + 4. The graph is the red region inside and including the parabola y = –x2 + 4. STEP 2 Graph y > x2– 2x – 3. The graph is the blue region inside (but not including) the parabola y = x2 –2x – 3. STEP 3 Identify the purple regionwhere the two graphs overlap. This region is the graph of the system.
Robotics The number Tof teams that have participated in a robot-building competition for high school students can be modeled by T(x) = 7.51x2 –16.4x + 35.0, 0 ≤ x ≤ 9 Where x is the number of years since 1992. For what years was the number of teams greater than 100? You want to find the values of xfor which: T(x) > 100 7.51x2 – 16.4x – 65 > 0 Graph y = 7.51x2 – 16.4x – 65 on the domain 0 ≤ x ≤ 9. The graph’s x-intercept is about 4.2. The graph lies above the x-axis when 4.2 < x ≤ 9. There were more than 100 teams participating in the years 1997–2001.
Solve a quadratic inequality algebraically Solve x2 – 2x > 15 algebraically. SOLUTION First, write and solve the equation obtained by replacing > with = . x2 – 2x = 15 Write equation that corresponds to original inequality. x2 – 2x – 15 = 0 Write in standard form. (x + 3)(x – 5) = 0 Factor. x = – 3 orx = 5 Zero product property
62 –2(6) = 24 >15 12 –2(1) 5 –1 >15 ANSWER The solution is x < – 3 orx > 5. The numbers – 3 and 5 are the critical x-values of the inequality x2 – 2x > 15. Plot – 3 and 5 on a number line, using open dots because the values do not satisfy the inequality. The critical x-values partition the number line into three intervals. Test an x-value in each interval to see if it satisfies the inequality. Test x = – 4: Test x = 1: Test x = 6:
What is different in the graphing process of an equality and an inequality? • If the equation is > or <, the parabola is dashed. • Either the inside or the outside of the parabola is shaded. Pick a point not on the parabola and see if it makes a true statement. If true, shade where the point is located. If not, shade the other area.
What is different in the graphing process of an equality and an inequality? How can you check the x-intercepts of a quadratic equation or inequality? Why is it important to test 3 intervals after you have found the critical x values?
Assignment 1.9 Page 70, 3-24 every 3rd problem, 36-57 every 3rd problem Assignment 1.9