Download
1 / 19
220 likes | 597 Vues
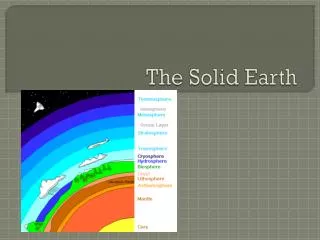
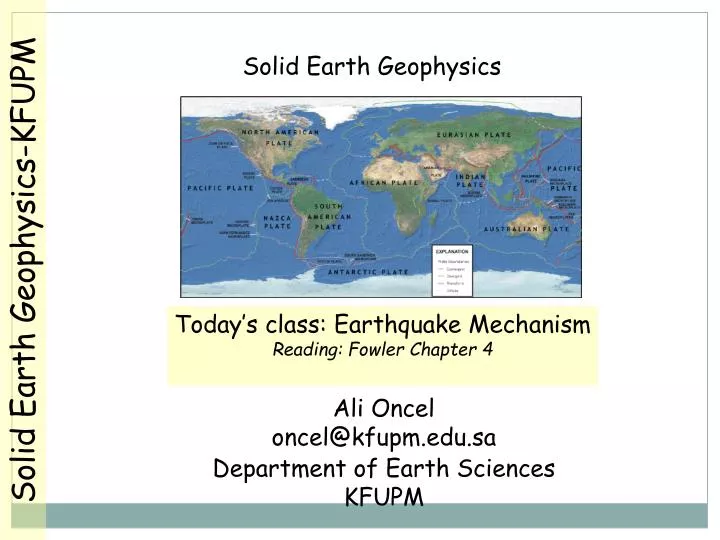
Solid Earth Geophysics. Solid Earth Geophysics-KFUPM. Today’s class: Earthquake Mechanism Reading: Fowler Chapter 4. Ali Oncel oncel@kfupm.edu.sa. Department of Earth Sciences KFUPM. Fault Model: Summing Subevents.

E N D
Solid Earth Geophysics Solid Earth Geophysics-KFUPM Today’s class: Earthquake Mechanism Reading: Fowler Chapter 4 Ali Oncel oncel@kfupm.edu.sa Department of Earth Sciences KFUPM
Fault Model: Summing Subevents Ms 7.5 on Motagua fault, transform segment of Caribbean-North American plate boundary caused enormous damage and 22,000 deaths. 1976 Guatemala Earthquake Source: Stein, 2003
Land shift Motagua, Guatemala February 4, 1976 Magnitude 7.5 Photo Credit: U.S. Geological Survey
Building Digital Solid Earth atlas.geo.cornell.edu Interactive Mapping
Focal Mechanism: the Interactive Database • Select your area by cursor • Then, click on button “submit” • Then, click on “Show Data Set” • From Geophysics, select “CMT Focal Mechanism” • Then, Click on “Submit Data Set”
Focal Mechanism Map Download the map under different options. JPG is easy to download but *.PS is good if making up for picture is needed. Then, just click the option “JPG”, and see the regional map of focal mechanisms.
World-wide Data Search Search Data for area of your term project from the below site and try to make a 3D map of Focal Mechanism Using the Software “ArcScene” above by USGS. http://neic.usgs.gov/neis/sopar/ http://pubs.usgs.gov/ds/2007/241/ 3D Focal Mechanisms Data Search: Example for Marmara Region (38-42N, 26-31 E)
Homework due May 23 • Through the Interactive Data Module which is explained so far • http://neic.usgs.gov/neis/sopar/ • Prepare the 3D focal mechanism map of the Marmara Area using the software: • http://pubs.usgs.gov/ds/2007/241/ • Also, try to provide a discussion about one paragraph: • Mechanism of Faulting • Direction of Regional Stress
Nuclear Explosions • An underground nuclear test can cause earth shaking like an M5 earthquake. • A lot of effort has gone into trying to being able to determine whether ground shaking is caused by a natural earthquake or a nuclear explosion. • Establishment of the World Wide Seismic Network in the 1960s was actually funded based on the need to monitor bombs, not studyearthquakes.
Nuclear Bomb: Compressional Source. P wave first motion in all directions. Slip on a fault: P wave first motion compressional and extensional. Earthquake or Bomb? How can we tell? Radiation patterns for Bomb and Earthquake are totally different due to differences in their sources as: Compressional and Shear.
Bomb Data recorded at Nilore, Pakistan. Nuclear tests are shallower than most earthquakes. Earthquake Nuclear tests generally have weaker surface waves and stronger P wave arrivals. Source: https://www.llnl.gov/str/Zucca.html
Nuclear explosions vs. Earthquakes Physics are different • Explosions are compressional sources • Generates strong P-waves, little shear energy (S-waves, Surface waves) • Earthquakes are shear sources • Generate all wave types, but dependent on radiation pattern Empirical methods are preferred for monitoring • Easy to implement • Quick (no heavy computations) Must be able to record and understand “regional” recordings • Waves that travel through crust are much more complex than those traveling through body of the earth (mantle) Source: Aaron A. Velasco, SACNAS, 2005.
Forensic Seismology Raw Data Filtered Data
Magnitude-Energy Mag.-Energy Plot Mag.-Energy Relation • Source Source: Murphy, 1996
Forensic Seismology Results • Event locates to North Korea • Event has strong Rg waves, implies shallow source • Events has high ratio of P/S, implies explosion • First motions up, implies explosion • Assuming an explosion, the magnitude (4.2 mb) indicates a yield of about 1 ~ kt
Russian Earthquake Explosion Detonated on August 29, 1949, it had a yield of 22 kilotons. Detonated on August 12, 1953, it had a yield of 400 kilotons. Detonated on September 14, 1954, it had a yield of 40 kilotons. Source: http://www.atomicforum.org/russia/russiantesting.html
Magnitude as a discriminator http://www.geoscienceworld.org/
Asperity Hazard Model • within the northern Marmara Sea region. TL(M) = dT/10 (a-bM) Log N = a – b M b-value : Material heterogeneity Applied shear stress level Thermal gradient Fault complexity Oncel and Wyss, 2000