Download
1 / 17
170 likes | 318 Vues
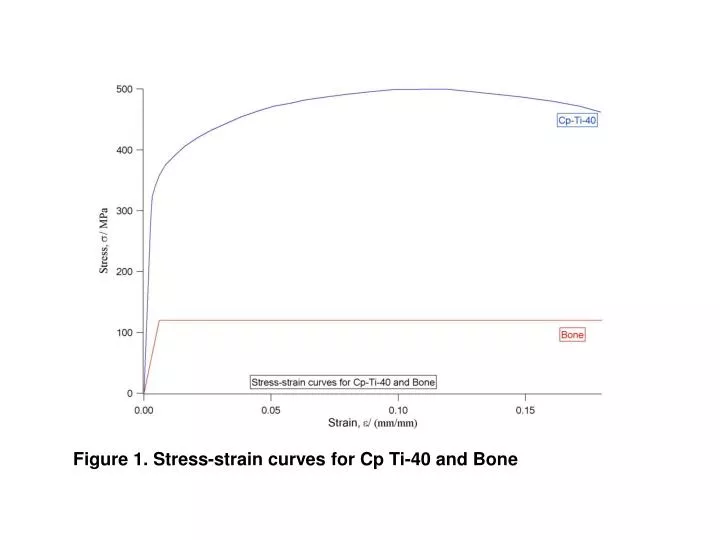
Figure 1. Stress-strain curves for Cp Ti-40 and Bone. (a). (b). (c). (d). (e). (f). (g). Figure 2 (a-g). Mesh for all geometries (a. standard; b. ellipse; c. move; d. size; e. random position; f. random size; g. random combination).

E N D
(a) (b) (c) (d) (e) (f) (g) Figure 2 (a-g). Mesh for all geometries (a. standard; b. ellipse; c. move; d. size; e. random position; f. random size; g. random combination)
Figure 3.Ti foam porosity (total, open and closed) as a function of time under thermal cycling conditions (4 minute cycles between 840 and 980 C)
Figure 4. Optical micrograph of Ti foam with 50% porosity, showing large, interconnected pores with ragged surfaces. Thin pore walls are also visible.
Figure5 Compressive stress-strain curve of foam shown in Figure 04 with 50% porosity
Figure7. Macroscopic stress-strain curve for porous standard model and definition of macroscopic yield stress
Figure8. Yield stress for all models, defined by 0.1% strain offset as shown in Figure7.
Figure9: Onset of local plastic deformation shown at macroscopic strain level 0.2% for several cases (a, b, c) and at macroscopic strain level 0.14% for random geometry (d). Red indicates local plasticity threshold achieved, while blue areas are in elastic regime. (a. standard, b. move in center, c. change in center; d. random combination) (a) (b) (c) (d)
(a) (b) (c) Figure 10. Stress contour plots for several porous geometries and 0.3% macroscopic strain level. (a. standard, b. ellipse, c. move in center, d. change in center, e. contour color scale; (Unit for stress is GPa)) (e) (d)
(a) (b) Figure 11. Shear banding appears centered in inclusions with largest plastic deformation for fully bone filling. (a. random position, b. change in center)
Figure12. Macroscopic stress-strain curve for selected models from finite element simulations. Symbols indicate the stress level at the onset of local plasticity in the matrix.
Figure13. Stress contour plots showing the effect of bone ingrowth on local deformation and stress fields. Macroscopic strain level is 0.2% in all cases. Note that bone ingrowth reduces local deformations and stress concentrations. The deformation field shown is magnified by a factor of 50. (a. fully porous, b. partial filled, c. fully filled, d. color scales) (a) (b) (c) (d)
Figure14. Macroscopic stress when first local plastic deformation appears
Figure 15. A measure of the stress concentration factor: the ratio of maximum stress to average stress of the matrix under purely elastic loading (macroscopic strain applied was 0.1% in order to have no local plasticity in the matrix or bone)
Figure 16a. The ratio of maximum strain to average strain of the matrix under 0.6% applied macroscopic strain (localized plasticity prevalent)
Figure 16b. The ratio of maximum stress to average stress of the matrix under 0.6% applied macroscopic strain (localized plasticity prevalent)