Download
1 / 60
600 likes | 607 Vues
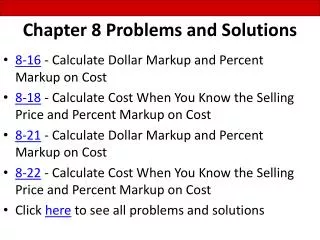
Chapter 8 Problems. Describe the differences between first, second, and third normal forms. Give an example of a function (transitive) dependency. 20. List the single-column functional dependencies in the following table. Table Normalization Assignment.

E N D
Chapter 8 Problems • Describe the differences between first, second, and third normal forms. • Give an example of a function (transitive) dependency. Lecture 9.2
20. List the single-column functional dependencies in the following table. Lecture 9.2
Table Normalization Assignment Put the following information into 3NF. Sales Order Widget Company 200 N Main Street Bangor, Maine 04401 Customer Number: 1001 Sales Order Number: 400 Customer Name: XYZ Company Sales Order Date: Oct. 3, 2017 Customer Address: 400 College Ave. Clerk Number: 210 Orono, Maine Clerk Name: Carmen San Diego 04469 Lecture 9.2
Un-normalized Table SalesOrderNo. Date CustomerNo. (CustNo.) CustomerName (CustName) CustomerAdd. (CustAdd.) ClerkNo. (ClrkNo.) ClerkName (ClrkName) ItemNo. ItemDesc. Quantity (Qty) UnitPrice Lecture 9.2
Putting the Table in 1NF Remove repeating groups: Lecture 9.2
Putting the Table in 2NF Remove partial dependencies. • The primary key must be a composite key. • The attribute(s) depend on only one part of the key. Lecture 9.2
Putting the Tables in 3NF Lecture 9.2
Final Tables Customer Table: CustNo., CustName, CustAdd Clerk Table: ClrkNo., ClrkName Inventory Table: ItemNo, Description Sales Order Table: SalesOrderNo., Date, CustNo., ClrkNo. Order Details Table: SalesOrderNo, ItemNo. Qty, UnitPrice Lecture 9.2
Basic Spatial Analysis Ch. 9 – Part 2 Lecture 9.2
Spatial data analysis Input -> spatial operation -> output Lecture 9.2
Reclassify in ArcGIS Lecture 9
Dissolve Lecture 9.2
The Modifiable Areal Unit Problem (MAUP) The results of data analysis are influenced by the number and sizes of the zones used to organize the data. The Modifiable Area Unit Problem has at least three aspects: • The number of ways in which fine-scale zones can be aggregated into larger units is often great. • The number, sizes, and shapes of zones affect the results of analysis. • There are usually no objective criteria for choosing one zoning scheme over another. Lecture 9.2 13
MAUP Example Lecture 9.2 14
A Real WorldExample Lecture 9.2
A Real World Example • The Supreme Court heard arguments on Tuesday in Gill v. Whitford, a gerrymandering case which many say will be the most important opinion of the term. • The Republican-run Wisconsin legislature, it’s claimed, created a redistricting plan so partisan that it guarantees their party stays in power even when they don’t get a majority of the vote. Lecture 9.2
The Supreme Court has been here before. In Vieth v. Jubelirer (2004) they declared that since there was no workable standard to resolve the issue, courts should stay out of the business of fixing alleged partisan gerrymandering. http://www.foxnews.com/opinion/2017/10/05/supreme-court-takes-on-gerrymandering-but-does-it-even-work.html Lecture 9.2
Buffers • A buffer creates polygons around input features to a specified distance. https://learn.environment.utoronto.ca/home/distance-education/all-programs/all-courses/gem-400-introduction-to-gis-for-environmental-management.aspx Lecture 9.2
Vector Buffers ArcGIS Desktop Help Lecture 9.2
Mechanics of Point and Line Buffering Lecture 9.2
Buffering Variants: point buffer examples Lecture 9.2
Regions in Buffering – inside, outside, enclosed Lecture 9.2
Overlay Analysis Combination of different data layers Both spatial and attribute data is combined Requires that data layers use a common coordinate system A new data layer is created Lecture 9.2
Vector Overlay • Topology is likely to be different • Vector overlays often identify line intersection points automatically. • Intersecting lines are split and a node placed at the intersection point • Topology must be recreated for later processing Any type of vector may be overlain with any other type Output typically takes the lowest dimension of the inputs For example: Point on Polygon results in a point Lecture 9.2
Ambiguous result Un-ambiguous result Lecture 9.2
Vector Overlay - Most common ways applied, but there are other methods. • CLIP • INTERSECTION • UNION Lecture 9.2
CLIP • Cookie cutter approach • Bounding polygon defines the clipped second layer • Neither the bounding polygon attributes nor geographic (spatial data) are included in the output layer Lecture 9.2
INTERSECTION • Combines data from both layers but only for the bounding area (Bounding polygon also defines the output layer Data from both layers are combined Data outside the bounding layer (1st layer) is discarded) Lecture 9.2
UNION • Includes all data from both the bounding and data layers • New polygons are formed by the combinations of the coordinate data from each layer Lecture 9.2
Erase Lecture 9.2
Identity Analysis • Computes a geometric intersection of the Input Features and Identity Features. • The Input Features or portions thereof that overlap Identity Features will get the attributes of those Identity Features. ArcGIS Desktop Help Lecture 9.2
Identity Analysis • The Input Features must be point, multipoint, line, or polygon. The Identity Features must be polygons. • Output may be multipart. If multipart features are not desired, use the Multipart to Singlepart tool on the output. ArcGIS Desktop Help Lecture 9.2
Symmetrical Difference Computes a geometric intersection of the input and update features. Features or portions of features in the input and update features which do not overlap will be written to the Output Feature Class. • The input and difference feature class and feature layer must have polygon geometry. • Output may be multipart. ArcGIS Desktop Help Lecture 9.2
Update Computes a geometric intersection of the Input Features and Update Features. The attributes and geometry of the input features are updated by the update features in the output feature class. The input must be a polygon. ArcGIS Desktop Help Lecture 9.2
Why do buffering and vector overlay often take so long? Because a time consuming line intersection test must be performed for all lines in the data layers Then, inside vs. outside regions must be identified for all new polygons Lecture 9.2
Finding the interior: Is a point inside a polygon (shaded)? Potential point Algorithm: Pick a direction (East (right) in the example) Count line crossings to the outside of convex hull (shaded polygon) If odd number then the point is inside If even, the point is outside Lecture 9.2
Vector Overlay Common features in Vector overlays create “Slivers” or “Sliver polygons” A common feature in both layers. The problem is that each definition is very subtly different (different time, source, materials) so the polygons don’t line up. They can only be seen a very large display scale but can represent over half the output polygons. They take very little space but affect analytical results. Lecture 9.2
Methods to reduce/remove slivers: • Redefine the common boundaries with highest coordinate accuracy and replace them in all layers before overlay • Manually identify and remove • Use snap distance during overlay Lecture 9.2
Eliminate Eliminate is often used to remove sliver polygons created during polygon overlay or buffering. With the LINE option, Eliminate merges selected arcs separated by pseudo nodes into single arcs. ArcGIS Desktop Help Lecture 9.2
Merge New parcels can be created by merging existing parcels in the parcel fabric. Adjacent parcels can be merged to create a single parcel, and disjoint parcels can be merged to create multipart parcels. Parcels being merged can be saved as historic parcels, kept current, or deleted. ArcGIS Desktop Help Lecture 9.2