Download
1 / 50
500 likes | 612 Vues
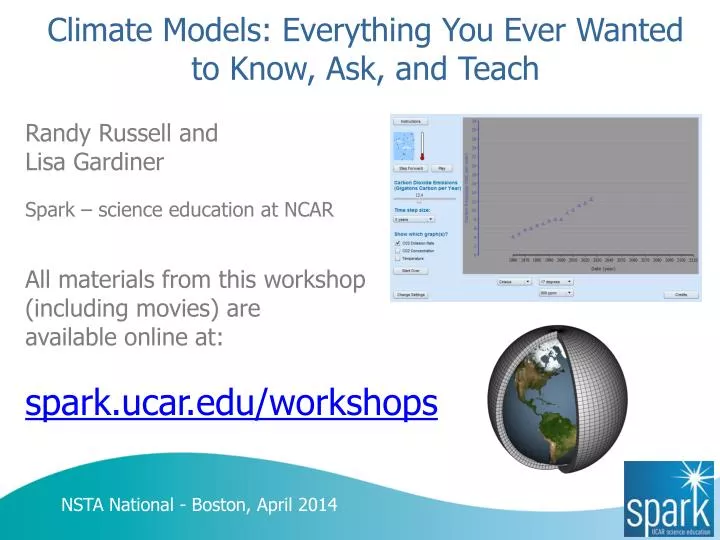
Climate Models: Everything You Ever Wanted to Know, Ask, and Teach. Randy Russell and Lisa Gardiner Spark – science education at NCAR All materials from this workshop (including movies) are available online at: spark.ucar.edu/workshops. NSTA National - Boston, April 2014.

E N D
Climate Models: Everything You Ever Wanted to Know, Ask, and Teach Randy Russell and Lisa Gardiner Spark – science education at NCAR All materials from this workshop (including movies) are available online at: spark.ucar.edu/workshops NSTA National - Boston, April 2014
National Center for Atmospheric Research in Boulder, Colorado
Workshop Overview • Climate model components • Resolution activity • Systems Game • The Very, Very Simple Climate Model • Climate/Carbon Bathtub
Using Models in Education “Essentially, all models are wrong, but some models are useful.” - George E. P. Box (1951)
Evolution of Climate Models Credit: Intergovernmental Panel on Climate Change (IPCC) Fourth Assessment Report (AR4): Working Group 1: Chapter 1, page 99, Fig. 1.2
Climate Model Components Credit: UCAR (Paul Grabhorn)
Improving Resolution of Climate Models • Grid Cell Sizes • 1990s (T42) • 200 x 300 km • 120 x 180 miles • 2000s (T85) • 100 x 150 km • 60 x 90 miles Credit: Warren Washington, NCAR
Improving Resolution of Climate Models Credit: Intergovernmental Panel on Climate Change (IPCC) Fourth Assessment Report (AR4): Working Group 1: Chapter 1, page 113, Fig. 1.4
Vertical Resolution of Climate Models • Vertical Layers • 1990s • 10 layer atmosphere • 1 layer “slab” ocean • 2000s • 30 layer atmosphere • 30 layer ocean Credit: UCAR
Hexagonal Grid and Sub-grids Credit: UCAR (Lisa Gardiner)
Resolution: Spatial & Temporal (Time) • Timesteps can be a few minutes to 12 hours or more • Durations can be hours to centuries
Resolution and Computing Power Double resolution – increase number of nodes – more calculations! One Dimension 2 times as many nodes Two Dimensions 4 times as many nodes
Resolution and Computing Power What if we increase model to three dimensions (space) plus time?
Resolution and Computing Power What if we increase model to three dimensions (space) plus time? 16 times as many nodes – 16x computing power required! This is why we need supercomputers!
Weather vs Climate Models Why do we think we can make meaningful 100 year climate projections when we can’t forecast the day-to-day weather a month from now?
Weather Model vs Climate Model Compare and Contrast • Differences (and similarities) between • Weather vs. Climate Models • Area Covered (scale) • Resolution – distance (spatial) and time (temporal) • Timespan covered by model runs • Impacts on computing resources needed, • time required to run models
Weather Model vs Climate Model Area Covered Weather Model – up to about continental size scale Climate Model – global size scale Larger area requires either more computing power/time or lower resolution (spatial and/or temporal)
Weather Model vs Climate Model Resolution and Precision • Weather Model • resolution typically about 3-10 km • timesteps of hourly to 6 hours, forecast for next 3-4 days • Climate Models • resolutions from about 25-30 km up to 100 (or a couple hundred) km • running computer models can take days or weeks, which would be impractical for weather models • Precision – why Wx forecast for Christmas is suspect, but temperature next July is reliable (relationship to chaos)
Weather Model vsClimate Model Timeframe Climate Projection – decades to centuries or longer (climate is usually defined as at least 30 years of observations) Weather Forecast – hours to days (up to about 10 days)
Source: Meehl et al NCAR
Greenhouse Effect Review • CO2 absorbs heat in the atmosphere • When heat accumulates in the Earth system, the average global temperature rises
Increased CO2 & the Greenhouse Effect • When the amount of carbon dioxide in the atmosphere increases, • average global temperature rises. • Longwave radiation emitted by CO2 is absorbed by the surface, • so average global temperature rises
Emissions -> More CO2 in Air -> Higher Temperature 18° 15°
Climate Sensitivity - definition Whenever the amount of carbon dioxide in the atmosphere doubles, average global temperature rises by 3 degrees Celsius. 18° 18° 15° 15°
Learning from the Past (ice cores) Ice age Ice age Ice age Ice age
CO2 Emissions – Where are we now? In 2014, CO2 emissions are around 10 gigatons (GtC) per year (10,000 million tons in units used on this graph)
CO2 in Atmosphere – Where are we now? • For hundreds of thousands of years, CO2varied between 180 and 280 parts per million, beating in time with ice ages • Since the Industrial Revolution, CO2 has risen very rapidly to about 400 ppm today 396 ppm in 2013 iceage iceage iceage iceage
Math of Climate Sensitivity When the CO2 concentration in the atmosphere doubles, temperature rises by 3°Celsius (about 5.4°F) Examples: • If CO2 rises from 200 ppmv to 400 ppmv, • temperature rises 3°C • If CO2 rises from 400 ppmv to 800 ppmv, • temperature rises 3°C • Note: as CO2 rises from 200 to 800 ppmv • (800 = 4 x 200), • temperature rises 6°C • ( = 2 x 3 degrees, not 4 x 3 degrees)
Climate Sensitivity Calculator demo spark.ucar.edu/climate-sensitivity-calculator
Climate Sensitivity Calculator Activity Use the calculator (previous slide) to determine the expected temperature for the various CO2 concentrations listed in column 1 of the table above (students fill in column 2); then have them graph.
Advanced Climate Sensitivity Math T = T0 + S log2 (C / C0) T : new/current temperature T0 : reference temperature (e.g. 13.7 degrees C in 1820) S : climate Sensitivity (3 degrees C) C : new/current atmospheric CO2 concentration C0 : reference atmospheric CO2 concentration (e.g. 280 ppmv in 1820) Example: What is new temperature if CO2 rises to 400 ppmv (from 280 ppmv)? T = T0 + S log2 (C / C0) = 13.7 + 3 log2 (400/280) = 13.7 + 3 log2 1.43 = 13.7 + 1.54 = 15.2 degrees C
Math of CO2 Emissions and Atmospheric Concentration Dry air mass of atmosphere = 5.135 x 10¹⁸ kg = 5,135,000 Gigatons CO2 currently about 599 ppm by mass (395 ppmv) = 0.0599% CO2 current mass = 0.0599% x 5,135,000 Gt = 3,076 Gt CO2 current emissions = 9.5 GtC/year Atmospheric fraction = 45% M = M0 + [0.45 x (3.67 x m)] = 3,076 GtCO2 + [0.45 x (3.67 x 9.5 GtC/yr)] = 3,076 + 15.7 GtCO2 = 3,092 GtCO2 CO2 concentration = 3,092/5,135,000 = 602 ppm by mass CO2 concentration = (602/599) x 395 ppmv = 397 ppmv (16 + 12 + 16) / 12 = 44/12 = 3.67 GtCvs GtCO2
Poll: Rising Emissions ? • A ? B ? C
Poll: Rising Emissions ? • A ? B ? C
Poll: Emissions rise then steady ? • A ? B ? C
Poll: Emissions rise then fall ? • A ? B ? C
Very Simple Climate Model demo spark.ucar.edu/simple-climate-model
Why does temperature continue to rise as emission rate declines? Atmosphere CO2 Emissions CO2 in Atmosphere CO2 Removal by Oceans & Plants spark.ucar.edu/climate-bathtub-model-animations-flow-rate-rises-falls spark.ucar.edu/imagecontent/carbon-cycle-diagram-doe
ALL Workshop Materials are Available Online at: spark.ucar.edu/workshops