Download
1 / 59
590 likes | 596 Vues
Analysis of socioeconomic data collected from censuses. United Nations Statistics Division. Main types of socioeconomic characteristics from censuses. Household and family characteristics Demographic and social characteristics Age Sex Marital status Disability Educational characteristics

E N D
Analysis of socioeconomic data collected from censuses United Nations Statistics Division
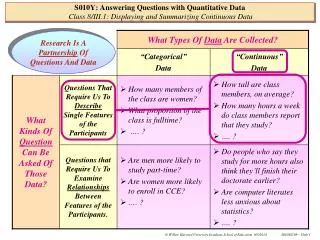
Main types of socioeconomic characteristics from censuses • Household and family characteristics • Demographic and social characteristics • Age • Sex • Marital status • Disability • Educational characteristics • Literacy • School attendance • Educational attainment • Economic characteristics • Labour force status • Status in employment • Occupation • Industry • Participation in own-use production of goods Core topics from the Principles and Recommendations for Population and Housing Censuses, Rev. 3
Socioeconomic data from censuses • The definitions used for socioeconomic indicators can have a significant impact on results • Consistency in how the question is phrased and how respondents understand the terms is key for internal consistency of data • Close inspection of definitions used must accompany any use of outside data sources for comparison of results
What can be done to check data quality? • Check the internal consistency of the data • Whether plausible when tabulated or cross-tabulated with other characteristics • Compare with other sources -indirect comparison • Graph the derived indicators • Cohort analysis of certain indicators • Disaggregate by sex and age • Compare with other sources- direct comparison • Post enumeration surveys, where people were re-interviewed and content of the census responses is verified • Matching records with other sources
Comparison with other sources • The possible sources of data for comparisons are: • Household Surveys, MICS, DHS, LFS, ..... • Registers • Population registers, • Vital registration systems, • School enrollment data, • Citizen identification systems, • Social security/health systems • Serious discrepancies between census and survey/administrative distributions for census topics are indicative of error in one or both sets of data - cause(s) should be investigated
Comparison with other sources • Close investigation on the followings: • The definitions used for socioeconomic data can have a significant impact on results – make sure that definitions used are consistent or investigate how differences in definitions would affect • Consistency in how the question(s) is phrased - the terms used for the questions can be key factor in comparison with other sources • Consistency in reference time-investigate how the differences in reference time would affect the results of evaluation
Comparisons with existing household surveys • The rationale for using existing household surveys to evaluate a census on a non-matching basis lies in the fact that • sample surveys are often less affected by nonsampling error than censuses due to the better operational control, qualified field staff with intensive tranning programme • therefore, survey data on population characteristics also measured by a census often are considered to be more accurate than the census results
Household composition • Most censuses use the household as the unit of enumeration • A “household” is typically defined by people (s) making common provision of food or other essentials • A household may consist of one person who provides for these essentials on his own • Not all household members (or even no household members) need be related • A “family” consists of individuals who are related by blood, adoption or marriage • Must contain at least 2 individuals • In many countries, there may be multiple family units residing in one household
Relationship to the reference person/head of household • Households may contain different types of family and non-family relationships • All individuals should be identified in relation to the reference person or head of household as follow: • Spouse, partner in consensual union, child, spouse of child, grandchild or great-grandchild, parent (or parent of spouse), other relative, domestic employee or other person not related to the head or reference person United Nations Workshop on Revision 3 of Principles and Recommendations for Population and Housing Censuses and Evaluation of Census Data, Amman 19 – 23 October 2014
Household and family composition • Types of household • One person household • Nuclear household-a single family nucleus • Extended household- • i. a single family nucleus and other persons • related to the nucleus • ii. two or more family nuclei with/without • other persons • iii. Two or more persons related to each other • d. Composite household- • i. a single nucleus and other persons , not • related the nucleus • ii. Two or more family nuclei, not related to • each other with/without other persons • e. Other • Family nucleus • A married couple without children • A married couple with unmarried children • A father with unmarried children • A mother with unmarried children • Couples living in consensual union may be regarded as constituting a family nucleus Household and family composition can be examined from different points of view, for census purposes:
Internal consistency • Distribution of household size • Accuracy of household size considering the number of persons enumerated in one page– such as 5, 10, … • There might be errors in combining the census forms belonging to same household
Household size – comparison with other sources Data source: graph produced based on data from the United Nations Demographic Yearbook and DHS STATcompiler
Average HH Size, Myanmar Average size 1983 census: 5.2 1997 FRHS:5.0 2001 FRHS:5.2 2007 FRHS: 4.9 Average HH size similar, but a significant difference in distribution by size
Disability Essential domains Additional domains • Defines as persons who experience limitations in basic activity functions • Walking • Seeing • Hearing • Cognition (remembering, concentrating, decision making, understanding language..) • Self-care • Communication (talking, listening, understanding speech)
Disability • Scale response • No (no difficult at all) • Yes, some difficulty • Yes, a lot of difficulty • Cannot do at all • Disability prevalence: includes those who have “a lot of difficulty” or “cannot do at all” for any of domains
Challenges in measuring disability Difficult to understand concept and definitions Proxy respondents Translation, taking into account cultural/psychosocial influences Questionnaire design
Example of Household questionnaire
Distribution of People with Disabilities, South Africa, 2011 Census
Marital status • Marital status is the personal status of each individual in relation to the marriage laws or customs of the country. The categories of marital status should at least include the following: • Single (never married) • Married • Married but separated-comprise both legally and de facto separated • Widowed and not married • Divorced and not married
Internal consistency control Expected pattern • smooth declining with ages • females are getting married in younger ages than males • males are getting married slightly younger ages in rural areas compared to urban areas
Internal consistency control 1994 Population and Housing Census of Tunisia Proportion of widowed men
Comparison with survey data • Very similar patter between the census and DHS • Slight difference in the last age group
Singulate Mean Age at First Marriage (SMAFM) • Technique for estimating the mean age at first marriage when actual dates of marriage are not available • Is a period measure (uses a synthetic cohort) • Very simple data requirements: • Total number of women by 5-year age groups • Total number of ever-married women by 5-year age groups
SMAFM calculation (1) PEMx: Proportion of ever-married women Source: Wachter, Ken, Essential Demographic Methods, Data from United Nations Demographic Yearbook PEMult
SMAFM calculation (2) Sx: proportion of remaining single at age 50 United Nations Workshop on Revision 3 of Principles and Recommendations for Population and Housing Censuses and Evaluation of Census Data, Amman 19 – 23 October 2014
Education • Three core concepts; • Literacy – ability to read and write a short, simple statement • School attendance – current, regular attendance at an accredited educational institution or program • Distinguished from enrollment, which means that the student is officially registered at school, not necessarily that s/he actually goes to class • Educational attainment – highest grade completed within the most advanced level reached in the educational system
Education • How to evaluate the quality of data: • Cohort analysis • Comparison of education indicators calculated from the census and other sources of data –household surveys, administrative registers • Plausibility in the distribution of data
Consistency control • Education • Educational attainment- highest level completed • Consistency control with school attendance and literacy • Relation with age –minimum age for completing school • Usually it is calculated by taking minimum age for entering school plus number of years required for completing a school. Example: • Minimum age for primary education is age 6 • If primary education requires 8 years, minimum age for completing primary school would be age 13
School attendance – Internal consistency Expected pattern ? Expected pattern ?
Cohort approach • Use the demographic concept of birth cohort to generate time series data for people who were born in the same year/period by their completed level of education and literacy • Analyze successive census data by cohorts - if they show the same or similar number/percentage for certain level of education while age increases • Assumptions: • Population size changes with births and deaths only – no migration • People do not continue education after reaching certain age - based on educational system in a country.
Cohort approach Data requirement :Consecutive population censuses by age groups, sex and literacy status and completed level of education Example for two successive censuses conducted in 1994 and 2004
Cohort approach Re- organization of data by birth cohorts
Cohort approach Impact of out-migration among literate population ?
Cohort approach Age misreporting? Impact of emigration? Expected pattern at older ages because of the effect of high mortality risk
Cohort approach Educationalattainment, Republic of Korea, 2000, 2005 and 2010 censuses
Cohort approach Educationalattainment, Republic of Korea, 2000, 2005 and 2010 censuses
Gross attendance ratio : Gross attendance ratio at level of education h in the year t : Students at the level of education h in the year t : Population in age group a which officially corresponds to the level of education h in year t
Net attendance rate : Net attendance rate at level of education h in the year t : Students of the population of age group a at level of education h in the year t : Population in age group a which officially corresponds to the level of education h in year t
Comparison with other sources • Census results indicate slightly lower level than the DHS • Census results are highly consistent with the results of DHS
Economic activity • Activity status – a person’s relationship to economic activity during a short reference period (typically a week) • Employed – a person who worked a defined, minimum amount of time over the reference period (may be as little as an hour) • Unemployed – a person who did not work the minimum amount of time during the reference period but was willing and able to work and looking for a job • Inactive (out of labor force)– a person who did not work the minimum amount of time during the reference period and did not want to work/was not looking for work • Both the employed and the unemployed are economically active! • Employed + unemployed = labor force
Economic activity • Difficulties: • What does “work” mean? • Goods and services produced for the market • Goods produced for own-use (replacing need to buy on market) • In practice, this is quite difficult to measure, especially in areas with large agricultural or informal economies • Women’s home-based production in particular is often undercounted in surveys • What does “looking for a job” mean? • E.g. some persons may have registered at a government labor office months ago, but done nothing else. Are they looking for a job?
Definition of Work • Defined as “any activity performed by persons of any sex and age to produce goods or to provide services for use by others or for own use • Five mutually exclusive forms of work • Own use production of work, production of goods and services for own final use • Employment work, work performed in exchange for pay or profit • Unpaid training work • Volunteer work • Other work activities United Nations Workshop on Revision 3 of Principles and Recommendations for Population and Housing Censuses and Evaluation of Census Data, Amman 19 – 23 October 2014
Definition of Employment Persons are all those above the specified age who during a short reference period of seven days or one week were engaged in any activity to produce goods and provide services for pay or profit United Nations Workshop on Revision 3 of Principles and Recommendations for Population and Housing Censuses and Evaluation of Census Data, Amman 19 – 23 October 2014