Download
1 / 7
70 likes | 197 Vues
Limitations of Global FDR. Less likely to be false positive. More likely to be false positive. Global FDR rejection region. threshold. 0. 1. Single hypothesis testing P -values. Global FDR method cannot associate the corrected significance with each hypothesis testing

E N D
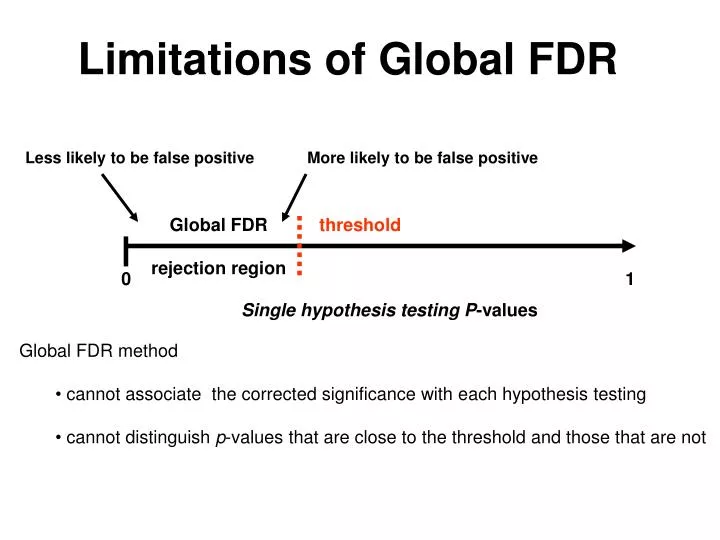
Limitations of Global FDR Less likely to be false positive More likely to be false positive Global FDR rejection region threshold 0 1 Single hypothesis testing P-values • Global FDR method • cannot associate the corrected significance with each hypothesis testing • cannot distinguish p-values that are close to the threshold and those that are not
How to assess to each feature its own measure of significance ?
Storey and Tibshirani method 2001 • Pi is the p value of the ordered gene i, Ri is the total number of rejected genes whose p-values are less than the threshold t=Pi and • Is an estimate of the total number of non-differentially expressed genes, m0 • the q-value tries to attach each feature with a significance measure • the q-value does not estimate the probability of the feature to be false positive q value =
Local FDR introduced by Efron 2004 H = 0 if the null hypothesis H0 is true (non-differential) T is the test statistic considered for all hypotheses T = t, a particular value of the test statistic
Local FDR Definition H = 0 if the null hypothesis H0 is true (non-differential) f0, f1 is the conditional density function corresponding to null hypothesis and alternative hypothesis, respectively
Different lFDR methods through different estimations of π0, f0 and f Efron’s 2004 restricted to π0 > 90% Aubert et al 2004 yields an estimator of large variance Sheid & Sprang’s 2004 computational extensive Broberg’s 2005 can substantially underestimate lFDR Dalmasso et al 2007 efficient and also compute gFDR
Different lFDR methods Efron’s J. Am. Stat Assoc 2004, 99:96 Aubert et al BMC Bioinformatics 2004, 5:125 Sheid & Sprang’s IEEE Transactions on computational biology and Bioinformatics 2004, 1:98 Broberg’s BMC Bioinformatics 2005, 6:199 Dalmasso et al BMC Bioinformatics 2007, 8:229