Download
1 / 15
150 likes | 280 Vues
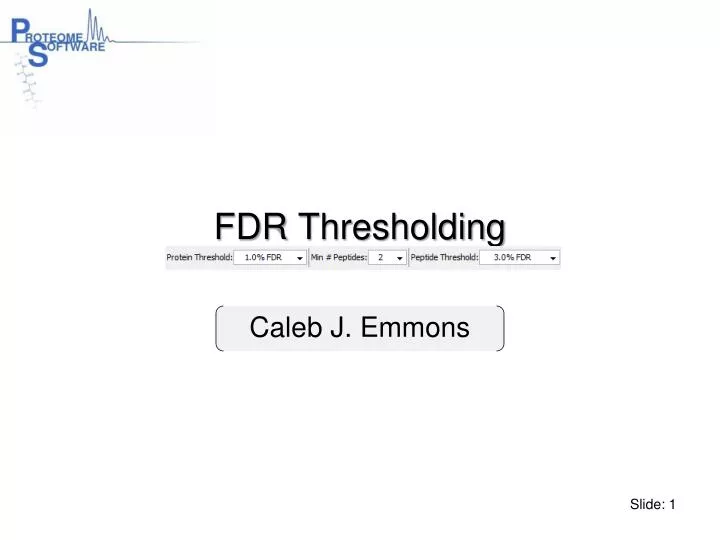
FDR Thresholding. Caleb J. Emmons. What is FDR?. If decoy proteins are present. # decoy proteins identified. Protein FDR =. # target proteins identified. # spectra from decoy proteins. Peptide FDR =. # spectra from target proteins. The FDR Browser. How does FDR Thresholding work?. 5.

E N D
FDR Thresholding Caleb J. Emmons
What is FDR? If decoy proteins are present # decoy proteins identified Protein FDR = # target proteins identified # spectra from decoy proteins Peptide FDR = # spectra from target proteins
How does FDR Thresholding work? 5 4 Minimum number of peptides 3 2 1 The “FDR Landscape”
How does FDR Thresholding work? The “FDR Landscape”
Confusing! Some Fine Points
Protein Clustering Poster 509, Tuesday 10:30-1:00 Informatics: Quantification/Validation Caleb J. Emmons
Total Peptide Evidence sum of peptide probabilities over all peptides matching A PEtot(A) =
Joint Peptide Evidence sum of peptide probabilities over all peptides matching AandB PEjoint(A, B) =
Cluster Formation Directly similar A ≈ Bif 1) their joint evidence is at least 95%, and 2) their joint evidence is at least half of the total evidence for A or B Clusters ProteinsA and B are in the same cluster if they are directly similar, or if they can be connected with a sequence of proteins that are directly similar.
Peptide-Protein Weights sum of peptide probabilities over all peptides exclusively matching C PEexcl(C) = W(p, C) = A B C
Spectrum Counting Exclusive peptide/spectrum: associated only with this single cluster/protein Unique peptides: only consider amino acid sequences Unique spectra: only consider amino acid sequence, modifications, & charge state Unique Spectra Total Spectra Exclusive Unique Peptides Exclusive Spectra B A C SEQ1, +2 SEQ2, +2 SEQ5, +2 SEQ7, +3 SEQ1, +3 SEQ3, +2 SEQ4,+2 SEQ7, +3
Quantitative Values Total and Weighted Spectrum Counts run over all spectra in the cluster Total Ion Current (TIC) and Precursor Intensity may be computed, treating the cluster as a collection of spectra. Normalized Spectral Abundance Factor (NSAF) roughly consists of a ratio of an exclusive spectrum count and protein length, so does not make direct sense on the level of cluster (as clusters do not have a ‘length’). However, the average NSAF over the member proteins gives an interpretable value. Similarly, we compute the Exponentially Modified Protein Abundance Index (emPAI) as an average over the member proteins in the cluster.