Download
1 / 29
310 likes | 460 Vues
David Field Thanks to…. Tom Johnstone, Jason Gledhill, FMRIB. Thresholding using FEAT. Overview. What is being thresholded? Multiple comparisons problem in FMRI Dealing with the multiple comparisons problem FWE control and other approaches Reproducibility of FMRI experiments

E N D
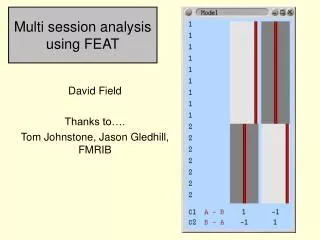
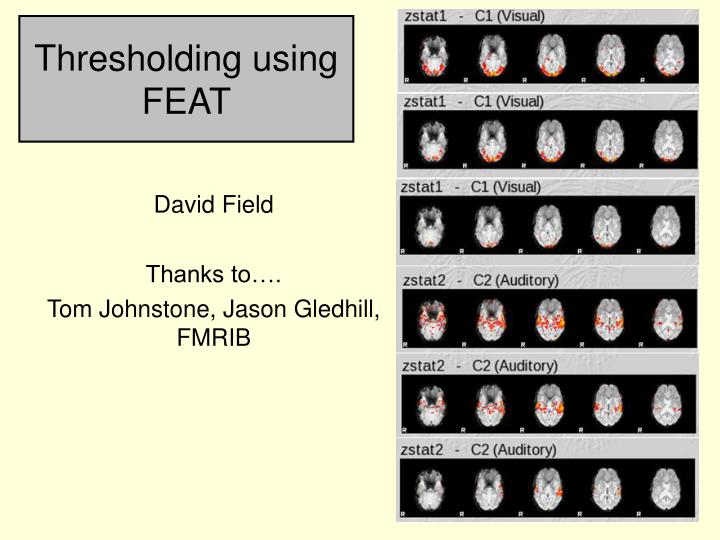
David Field Thanks to…. Tom Johnstone, Jason Gledhill, FMRIB Thresholding using FEAT
Overview • What is being thresholded? • Multiple comparisons problem in FMRI • Dealing with the multiple comparisons problem • FWE control and other approaches • Reproducibility of FMRI experiments ________________________________________ • Writing FSL scripts and batch files in Linux
Thresholding – the starting point • Each COPE is divided by its standard error to produce a volume of t statistics • t is a measure of estimated effect size relative to the degree of uncertainty of the estimate • A large t arises from a large effect size, a small amount of uncertainty due to measurement error, individual variation and “noise”, or both at once • FSL converts t to z prior to thresholding • z is more convenient, but for large N, z and t are equivalent anyway
Intuitive thresholding • When COPE > error & noise, then z > 1 • If z is >> 1, there is probably an effect of interest present • Open an unthresholded zstat image in FSLVIEW and manually threshold it • note that the negative values of z have the same interpretation except that the COPE value is negative, so the direction of effect is reversed • conventionally, to look at these negative values you reverse the COPE to make them positive (e,g. -1 instead of 1)
Formal thresholding – converting z to a p value • Assuming the null hypothesis, the expected value of the COPE would be 0 with some error/noise added, and so the value of z would be small • z can tell us the probability at each voxel that the observed COPE might be simply due to the error/noise: • z > 1, p = 0.31: i.e. 30% chance • z > 2, p = 0.046: i.e. less than 5% chance • z > 3, p = 0.0027: i.e. less than 0.3% chance
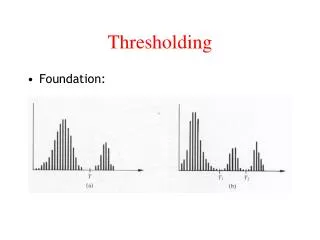
Formal thresholding – converting z to a p value • We can apply a threshold to the data: show only voxels where z > z'. e.g z > 2 or z > 3 No thresh. z > 1 z > 2 z > 3
Multiple comparisons problem • If we thresholded an image of pure noise (i.e. no real effect) using a threshold of z > 2.1 (p < 0.05) at each voxel, with 200,000 voxels • 0.05*200,000 = 10000 voxels would survive thresholding • false positives: “apparent” activation • One solution is to control the familywise error rate (FWE) • This means that you adjust thresholding so that the total risk of one or more false positives among all the tests performed is < 0.05 (or other desired p) • The Bonferroni method is to divide the desired p by the total number of independent tests performed • 0.05 / 200,000 = 0.00000025, so threshold at z > 5 • But this assumes all voxels to be independent, which is very wrong for fMRI data. So the Bonferroni correction is overly strict for fMRI, and we may miss real activation.
Voxelwise FWE option in FEAT poststats • If you select this option you are controlling the probability of one or more false activations occurring in the whole image • the effective number of tests is equal to the estimated number of RESELS in the image • lots of assumptions (works better if you smooth more) • Assumptions not met for group analysis with small N, where the small number of observations at each voxel makes estimation of image smoothness unreliable • If you select the “Uncorrected” option in FEAT, this means “uncorrected for multiple comparisons”
Cluster based thresholding • If you carry out uncorrected thresholding with z > 2.3 (p < 0.01) and look at the results • some clusters will be very small (just one or two voxels) • other clusters will be large (100’s of voxels) • The voxelwise FWE has not been controlled, so there will be false positive activations in the image • Intuitively, the small activation clusters are more likely to arise due to random sampling from a null disribution than the large clusters • unless you are expecting a small activation in a specific region, e.g. superior colliculus
Cluster based thresholding z' space Significant Voxels No significant Voxels z' is the threshold, e.g. z > 3 (p < 0.001) applied voxelwise
Cluster based thresholding z' space Significant Voxels z' is the threshold, e.g. z > 2.3 (p < 0.01) applied voxelwise
Cluster based thresholding z' space Cluster not significant Cluster significant Intuitively, under the null hypothesis (i.e. in an image of pure noise/error), the lower the voxelwise z', the larger the false-positive clusters we are likely to see. Random Field Theory (RFT) can be used to estimate how big a cluster needs to be at a given voxelwise threshold for it to be highly unlikely (e.g. p < 0.05) that we would see any such clusters under the null hypothesis *This critical cluster size also depends on the smoothness of the data, but RFT takes that into account
Cluster based thresholding z' space Cluster significant Cluster not significant k k So, it's a two-stage procedure: - threshold the image voxelwise at a certain z' - apply RFT to keep only those clusters that are big enough for that z' to ensure an overall (Familywise) p < 0.05 There are no set rules for what voxelwise z' to use when doing cluster based thresholding.
Dependency of number of clusters on choice of voxelwise threshold High voxelwise z': able to detect small clusters of highly activated voxels, but miss larger clusters of somewhat less activated voxels Low voxelwise z': unable to detect small clusters of highly activated voxels, but capture larger clusters of somewhat less activated voxels Choice will depend on nature of task and hypotheses concerning size/region of activations The number and size of clusters also depends upon the amount of smoothing that took place in preprocessing
Cluster based thresholding in FEAT • If you choose the cluster option on the postats tab you set two thresholdingvalues • the first one is an uncorrected voxelwise threshold. This is typically quite liberal, e.g. z > 2.3 (p < 0.01) • the second is the familywise error threshold: the probability of one or more false positive clusters in the image. Usually this is set to p < 0.05 Familywise p Voxelwise z'
Dependency of cluster size threshold on voxel level threshold (example data) FWE p < 0.05
Summary of thresholding options in FSL • Voxelwise, uncorrected for multiple comparisons • This can be useful for checking data quality but is almost never acceptable for published research • Voxelwise, p value is the probability of one or more falsely activated voxels in the image • but the number of independent comparisons is less than the number of voxels • Clusterwise, p value is the probability of one or more falsely activated clusters in the image • results dependant upon initial voxelwise uncorrected threshold
Other thresholding options • Nonparametric approaches • permutation testing • FDR (false discovery rate) • Why control the FWE? • As researchers, what we really want to control is the proportion of voxels declared active that are false positives • Choosing an FDR of 0.01, if you declare 1000 voxels active, on average across many samples, 10 of them will be false positives • If there were only 200 activated voxels ~= 2 false positives • This makes more sense than controlling the probability of a single false positive in the whole brain • FDR works well with unsmoothed data (unlike FWE), and it is available using a command line program in FSL
Brain masks: reducing the number of voxels • FWE and FDR both become more conservative as the number of voxels in the image increases • You don’t expect activations in the white matter or ventricles • this suggests that performing tissue segmentation and removing non-grey matter voxels from the image prior to the model fitting stage is a good idea • Caution: the presence “activation” in white matter or ventricles is often a clue indicating head motion problems or image spikes • so, run the analysis with all voxels in first • If you are only interested in a specific part of the brain then consider scanning only that part of the brain • this will also permit a shorter TR or smaller voxels • but also acquire a whole_head epi for registration purposes • Or extract a region of interest “ROI” for separate analysis
Thresholding – an alternative view • Genovese, Lazar, & Nichols (2002) • “Variation across subjects has a critical impact on threshold selection in practice. It has frequently been observed that, even with the same scanner and experimental paradigm, subjects vary in the degree of activation they exhibit, in the sense of contrast-to-noise. Subjective selection of thresholds (set low enough that meaningful structure is observed, but high enough so that appreciable random structure is not evident) suggests that different thresholds are appropriate for different subjects” • So, perhaps intuitive thresholding is best after all? • I have seen this used in published papers
Thresholding – an alternative view • Journal reviewers and editors are always reassured if the rate of false positives has been controlled using FWE • this is why researchers make every effort to produce activations that survive this very stringent test • However, there is a trade-off between the false positive rate and the false negative rate • Use of FWE might be producing the wrong balance between these two types of error
Thirion (2007), reproducibility of imaging results • Classical statistical inference with a single data set provides control of the false positive rate • but it does not quantify the probability that there is a real effect in the population, which is not reflected in this specific sample due to chance (false negative rate) • If an experiment is repeated many times, and the activations are almost identical each time this implies that both false positive and false negative rates are low • If the activations are slightly different each time this could be due to the presence of false positives, false negatives, or a mixture of both • Therefore, reproducibility provides a way of knowing something about how many real activations are actually being rejected by thresholding
Thirion (2007), reproducibility of imaging results • Scanned 80 people on a number of standard localizer paradigms, e.g. motor cortex localiser • Randomly selected a sample of 20 people from the “population” of 80 • Repeat for all possible samples of 20 • Repeat for different sample sizes • Repeat for different thresholding methods
Thirion (2007), reproducibility of imaging results • Voxel level thresholds: best reliability was achieved when the p value was between 0.0035 and 0.001 uncorrected • So, allowing about 2 out of every 1000 voxels in the brain to be declared active incorrectly produces the best trade off between the FP rate and the FN rate • obsessing about controlling the probability of a single FP in the whole data set is not a good thing…..
Thirion (2007), reproducibility of imaging results • Nonparametric, permutation based methods had better reliability than parametric methods • Carrying variance estimates as well as effect size forward from 1st to 2nd level improved reliability • (i.e. Mixed effects as advocated by FSL better than random effects) • Cluster level FWE more reliable than voxel level FWE for group analysis • High random effects stats values (cope) coincide with highest areas of group variance (varcope) • Indicative of spatial misregistration between subjects?
Thirion (2007), reproducibility of imaging results • In general, adequate reproducibility of group level results was achieved with a sample size of 20-27 • Many FMRI studies use 10-14 participants….
Shell scripting • This can save you a lot of time • enough to open up analysis possibilities that would otherwise be impractical • Some of the FSL programs don’t have a GUI • e.g. fslmaths • It’s more efficient to call these programs through a script that you save on the disk than entering the commands by hand for each participant / session • http://www.fmrib.ox.ac.uk/fslcourse/lectures/scripting/index.html