Download
1 / 6
60 likes | 181 Vues
IOC Diagram for Backer Roll Design Optimization:. Summary: 18 factors and 9 responses (transfer functions) investigated. Of the 18 factors, there are 2 CP’s and 2 Noises. Introduction (continued). Response Descriptions, Weights and Limits for Backer Roll Design Optimization:. Empirical

E N D
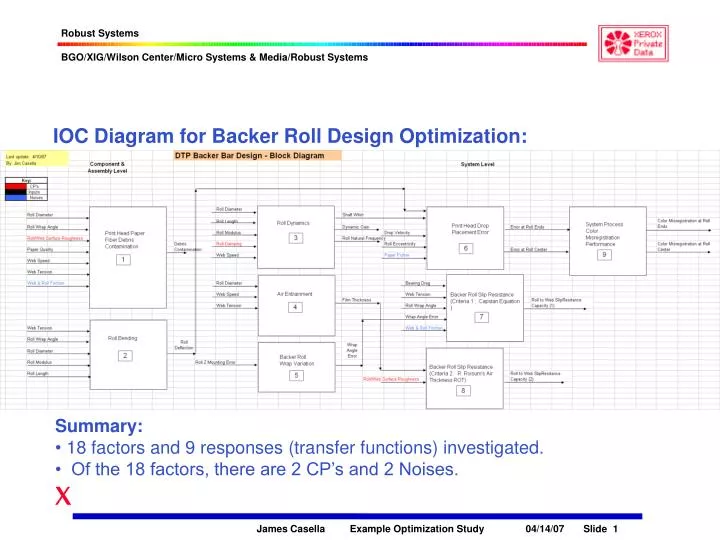
IOC Diagram for Backer Roll Design Optimization: • Summary: • 18 factors and 9 responses (transfer functions) investigated. • Of the 18 factors, there are 2 CP’s and 2 Noises.
Introduction (continued) Response Descriptions, Weights and Limits for Backer Roll Design Optimization: Empirical Equation Closed Form Equations
Procedure (using DFSS application Software): Create the IPO design sheet (DFSS/Create Design Sheet): Enter all factors, distribution types and distribution parameters for the existing factor set points. Enter transfer functions and other equations necessary to enable the process flow represented in the system IOC diagram. For each response, enter the LS & US limits. Run EVA (DFSS/EVA): Run an Expected Value Analysis to establish a latitude baseline for all responses under investigation. Look for unacceptable low Cpk and high DPM results. Run Parameter Design Optimization (DFSS/Parameter Design): For each factor, enter the range for which it’s mean will be investigated. For each response, enter the weighting (priority) for optimizing each response latitude. The parameter optimization will reset the factor nominals to achieve target results. Re-run EVA for new baseline latitude performance. Repeat for various weightings if necessary. Run Tolerance Design (DFSS/Tolerance Design): If necessary, reduce tolerances (or open if possible) to enable cost effective system performance goals. Re-run EVA to establish new baseline.
Results – Baseline Evaluation: Summary: Initial factor set points generate poor process capability for 4 out of 7 critical responses.
Results - Parameter Design Setup: Inputs show factor ranges enabled to explore design optimization opportunities.