Download
1 / 21
210 likes | 211 Vues
Inferences on human demographic history using computational Population Genetic models. Gabor T. Marth. Department of Biology Boston College Chestnut Hill, MA 02467. The current variation resource. The current public resource (dbSNP) contains over 10 million SNPs.

E N D
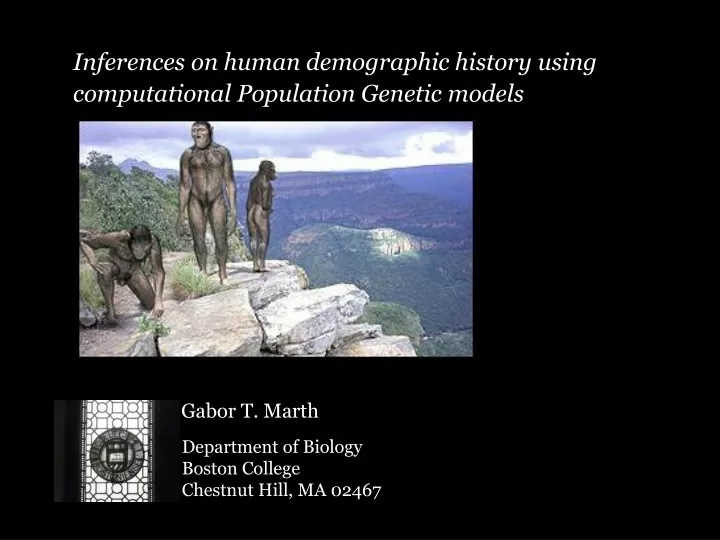
Inferences on human demographic history using computational Population Genetic models Gabor T. Marth Department of Biology Boston College Chestnut Hill, MA 02467
The current variation resource • The current public resource (dbSNP) contains over 10 million SNPs 1. How are these SNPs structured within the genome? 2. What can we learn about the processes that shape human variability? 3. What is the utility of these data for medical applications?
in different regions of given lengths Nucleotide diversity is heterogeneous at the scale of the chromosomes
3’ UTR 5.00 x 10⁻⁴ 5’ UTR 4.95 x 10⁻⁴ Exon, overall 4.20 x 10⁻⁴ Exon, coding 3.77 x 10⁻⁴ synonymous 366 / 653 non-synonymous 287 / 653 functional constraints Compositional and functional features G+C nucleotide content CpG di-nucleotide content recombination rate Variance is so high that these quantities are poor predictors of nucleotide diversity in local regions, hence random processes are likely to govern the basic shape of the genome variation landscape described byneutral theory
allele frequency spectrum (AFS): distribution of SNPs according to allele frequency in a set of samples “common” “rare” Strategy – study observable distributions marker density (MD): distribution of number of SNPs observed in pairs of sequences
region of strong allelic association region of reduced haplotype diversity Strategy – modeling approach • Build models of fundamental forces (drift, mutation process, demography, recombination, selection) that accurately describe these distributions • Use these same models to improve our expectations of allelic association (linkage disequilibrium, LD) and human haplotype structure, properties less amenable to measurement but fundamental for medical association
past N3 N2 T2 present T1 N1 simple, but dynamic model of demography Tool – the Coalescent process • Trace the genealogy of samples at hand, through significant events (e.g. coalescent, recombination) back into the past, until the Most Recent Common Ancestor of all samples is found. The shape of the genealogy is modulated by the underlying model structure and parameters. • Add mutations according to a neutral mutation model • Tabulate the statistical properties of the resultant polymorphic structure
parameter i parameter j computable formulations 1/5 2/5 3/5 Model generation and model fitting simulation procedures
Model expectations – Demography bottleneck stationary collapse expansion past history present MD (simulation) AFS (direct form)
best model is a bottleneck shaped population size history • data fit very good at each length examined (4-16 kb) N3=11,000 N2=5,000 T2=400 gen. N1=6,000 T1=1,200 gen. present Model fitting in BAC marker density data Marth et al., PNAS 2003 • our conclusions from the marker density data are confounded by the unknown ethnicity of the public genome sequence • we looked at allele frequency data from ethnically defined samples
model consensus: bottleneck N3=10,000 N2=2,000 T2=400 gen. N1=20,000 T1=3,000 gen. present The frequency spectrum in European samples How general are these observations?
bottleneck modest but uninterrupted expansion African spectra tell a different story European data African data Marth et al., Genetics, in press
contribution of the past to alleles in various frequency classes average age of polymorphism Predictions – Age of polymorphisms European data African data
Predictions – Linkage disequilibrium* * LD measures the strength of allelic association between two markers
African-American spectra – Admixture? African spectrum European spectrum
block a few frequent haplotypes (e.g. 10% min. frequency) make up the majority of all observed haplotypes (e.g. > 80%) Haplotype structure – Haplotype blocks • These predictions agree with experimental observations from other labs, most notably with the presence of regions of strong allelic association, termed “haplotype blocks”, evident primarily in European samples. Daly et al., Nature Genetics, 2001
1. Frequent haplotypes can be used as markers for functional variants 2. Significant marker reduction possible • HapMap Initiative: map haplotype blocks across the entire human genome • Questions of generality within and across human populations patterns in reference samples patterns in clinical samples ? The HapMap initiative • The promise
Going back to our own studies, we predict haplotype block size under African demographic history as roughly half the European size (consistent with observations) To what degree do “blocks” coincide? Predictions – Haplotype structure • We examine this question from the standpoint of demographic history (an obvious candidate to cause population specific differences) • We have to analyze the spatial relationships between the polymorphic structure of different populations
“migration” • The genealogy of samples from different populations are connected through the shared part of our past • Polymorphic markers (some shared, some population-specific) and haplotypes are placed into a common frame of reference Connecting ethnic demographies • The “true” history of all human populations is interconnected • We study these relationships with models of population subdivision “African history” “European history”
SNPs private to European samples shared SNPs SNPs common in both populations SNPs private to African samples Predictions – Joint allele frequency observation in UW PGA data • our simple model of subdivision captures the qualitative dynamics • alleles often have different frequencies in different populations • we now have the tools to start evaluating and guiding the design for variation resources that are general for all populations