Download

1 / 20
200 likes | 363 Vues
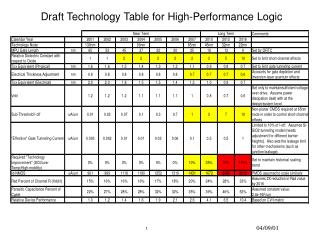
HERON Performance -DRAFT-. Created for meeting with Oracle representatives on November 14, 2013 Nathan Graham – Software Engineer Brandon Hamlin – Oracle DBA. Outline. Hardware/software/data specifications HERON/i2b2 star schema i2b2 generated queries use temp tables

E N D
HERON Performance-DRAFT- Created for meeting with Oracle representatives on November 14, 2013 Nathan Graham – Software Engineer Brandon Hamlin – Oracle DBA
Outline • Hardware/software/data specifications • HERON/i2b2 star schema • i2b2 generated queries use temp tables • HERON monthly release process • Performance Problems • User query times seemed to suddenly increase • Bitmap indexes • Observations/Diagnosis • Poor execution plans • Efforts to resolve • Oracle table statistics
Outline (continued) • Ongoing Frustrations/Questions • Table statistics migration each month as a workaround • Why does Oracle CBO consistently pick bad plans based on automatic table statistics? • Performance Metrics • Automated weekly performance tests • Automated daily execution plan tests • Moving Forward • How do we effectively optimize Oracle 11g for i2b2? • Partitioning postgreSQL vs. Oracle
Hardware/Software Specifications • i2b2 Database Server: • SUSE Linux Enterprise Server 11 SP3 (x86_64) • Oracle 11g (11.2.0.3) • i2b2 v1.6.09 • FusionIOsolid-state disks • 70G of RAM • 12 hyper-threaded CPUs • 1 billion plus rows in the i2b2 observation_fact table
HERON/i2b2 star schema Taken from: https://www.i2b2.org/events/slides/Workshop1.pdf
i2b2-generated queries use temp table • i2b2 generates user queries by using a temp table • Results of the first panel are inserted into a temp table • The temp table is then updated with the criteria of the second panel, third, etc.
Example Query Steps --Step 1: INSERT INTO BlueHerondata.QUERY_GLOBAL_TEMP ( patient_num , panel_count ) SELECT patient_num , 1 AS panel_count FROM (SELECT patient_num FROM BlueHerondata.observation_fact WHERE concept_cd IN (SELECT concept_cd FROM BlueHerondata.concept_dimension WHERE concept_path LIKE '\i2b2\Diagnoses\Endocrine disorders (240-259)\Other endocrine gland diseases (250-259)\(250) Diabetes mellitus\%' ) GROUP BY patient_num ) t ; -- Step 2: UPDATE BlueHerondata.QUERY_GLOBAL_TEMP SET panel_count =2 WHERE EXISTS (SELECT 1 AS panel_count FROM (SELECT patient_num FROM BlueHerondata.observation_fact WHERE concept_cd IN (SELECT concept_cd FROM BlueHerondata.concept_dimension WHERE concept_path LIKE '\i2b2\Diagnoses\Neurologic Disorders (320-389)\(346) Migraine\%' ) GROUP BY patient_num ) t WHERE BlueHerondata.QUERY_GLOBAL_TEMP.panel_count = 1 AND BlueHerondata.QUERY_GLOBAL_TEMP.patient_num = t.patient_num ) ;
HERON monthly release process • Two full copies of production data • ETL takes around 65 hours to go from Epic Clarity to i2b2 star schema • Once ETL completes we run automated and manual tests • Check performance metrics • Usually have to migrate table statistics from the previous month to get acceptable performance (more on that later) • Once testing is complete, the i2b2 web client server is pointed to the new instance
Performance Problems • We observed a sudden increase in user query times which prompted investigation Real-time user performance (internal only): https://heron.kumc.edu/heron/reports/performance
Bitmap Indexes • Suggestion from i2b2 AUG member • Peter Beninato <beninato@ohsu.edu> • Source code: • https://informatics.kumc.edu/work/browser/heron_load/i2b2_facts_index.sql • Several i2b2 columns – general formula: … create bitmap index &&star.OBS_FACT_PAT_NUM_BI on &&star.observation_fact (PATIENT_NUM) &&index_opts; …
Poor Execution Plans (example) • Hash join rather than nested loops (small temp table, large observation_fact table) • Bad execution plan (step 3 of 2012-04-27_6498_rwaitman.sql) Plan hash value: 2180584874 -------------------------------------------------------------------------------------------------------------------------------------------- | Id | Operation | Name | Rows | Bytes | Cost (%CPU)| Time | TQ |IN-OUT| PQ Distrib | -------------------------------------------------------------------------------------------------------------------------------------------- | 0 | UPDATE STATEMENT | | 2088 | 54288 | 146M(-74)|486:49:02 | | | | | 1 | UPDATE | QUERY_GLOBAL_TEMP | | | | | | | | |* 2 | FILTER | | | | | | | | | | 3 | TABLE ACCESS FULL | QUERY_GLOBAL_TEMP | 41756 | 1060K| 24 (0)| 00:00:01 | | | | | 4 | VIEW | | 1 | 13 | 3713 (1)| 00:00:45 | | | | | 5 | SORT GROUP BY | | 1 | 188 | 3713 (1)| 00:00:45 | | | | |* 6 | PX COORDINATOR | | | | | | | | | | 7 | PX SEND QC (RANDOM) | :TQ10001 | 11 | 2068 | 3713 (1)| 00:00:45 | Q1,01 | P->S | QC (RAND) | |* 8 | FILTER | | | | | | Q1,01 | PCWC | | |* 9 | HASH JOIN | | 11 | 2068 | 3713 (1)| 00:00:45 | Q1,01 | PCWP | | | 10 | BUFFER SORT | | | | | | Q1,01 | PCWC | | | 11 | PX RECEIVE | | 1029 | 30870 | 249 (0)| 00:00:03 | Q1,01 | PCWP | | | 12 | PX SEND BROADCAST | :TQ10000 | 1029 | 30870 | 249 (0)| 00:00:03 | | S->P | BROADCAST | | 13 | TABLE ACCESS BY INDEX ROWID | OBSERVATION_FACT | 1029 | 30870 | 249 (0)| 00:00:03 | | | | | 14 | BITMAP CONVERSION TO ROWIDS| | | | | | | | | |* 15 | BITMAP INDEX SINGLE VALUE | OBS_FACT_PAT_NUM_BI | | | | | | | | | 16 | PX BLOCK ITERATOR | | 6666 | 1028K| 3464 (1)| 00:00:42 | Q1,01 | PCWC | | |* 17 | TABLE ACCESS FULL | CONCEPT_DIMENSION | 6666 | 1028K| 3464 (1)| 00:00:42 | Q1,01 | PCWP | | --------------------------------------------------------------------------------------------------------------------------------------------
Good Execution Plan (example) • Same step 3 of 2012-04-27_6498_rwaitman.sql ------------------------------------------------------------------------------------------------------------------ | Id | Operation | Name | Rows | Bytes |TempSpc| Cost (%CPU)| Time | ------------------------------------------------------------------------------------------------------------------ | 0 | UPDATE STATEMENT | | 1 | 39 | | 1197 (1)| 00:00:15 | | 1 | UPDATE | QUERY_GLOBAL_TEMP | | | | | | |* 2 | HASH JOIN SEMI | | 1 | 39 | | 1197 (1)| 00:00:15 | |* 3 | TABLE ACCESS FULL | QUERY_GLOBAL_TEMP | 1 | 26 | | 2 (0)| 00:00:01 | | 4 | VIEW | | 4926 | 64038 | | 1194 (1)| 00:00:15 | | 5 | SORT GROUP BY | | 4926 | 889K| 976K| 1194 (1)| 00:00:15 | | 6 | NESTED LOOPS | | | | | | | | 7 | NESTED LOOPS | | 4926 | 889K| | 1193 (0)| 00:00:15 | | 8 | TABLE ACCESS BY INDEX ROWID| CONCEPT_DIMENSION | 1 | 155 | | 5 (0)| 00:00:01 | |* 9 | INDEX RANGE SCAN | CONCEPT_DIMENSION_PK | 1 | | | 4 (0)| 00:00:01 | | 10 | BITMAP CONVERSION TO ROWIDS| | | | | | | |* 11 | BITMAP INDEX SINGLE VALUE | OBS_FACT_CON_CODE_BI | | | | | | | 12 | TABLE ACCESS BY INDEX ROWID | OBSERVATION_FACT | 4926 | 144K| | 1193 (0)| 00:00:15 | ------------------------------------------------------------------------------------------------------------------
Poor Execution Plan (another example) • 2012-05-08_6613_jgreenwood.sql – Took 3800+ seconds! ---------------------------------------------------------------------------------------------------------- | Id | Operation | Name | Rows | Bytes | Cost (%CPU)| Time | ---------------------------------------------------------------------------------------------------------- | 0 | UPDATE STATEMENT | | 43 | 1118 | 1733 (1)| 00:00:21 | | 1 | UPDATE | QUERY_GLOBAL_TEMP | | | | | |* 2 | FILTER | | | | | | | 3 | TABLE ACCESS FULL | QUERY_GLOBAL_TEMP | 865 | 22490 | 2 (0)| 00:00:01 | | 4 | VIEW | | 1 | 13 | 4 (0)| 00:00:01 | | 5 | SORT GROUP BY | | 1 | 410 | 4 (0)| 00:00:01 | |* 6 | FILTER | | | | | | | 7 | NESTED LOOPS | | 1 | 410 | 4 (0)| 00:00:01 | | 8 | TABLE ACCESS BY INDEX ROWID| CONCEPT_DIMENSION | 1 | 379 | 0 (0)| 00:00:01 | |* 9 | INDEX RANGE SCAN | CONCEPT_DIMENSION_PK | 1 | | 0 (0)| 00:00:01 | | 10 | BITMAP CONVERSION TO ROWIDS| | 1 | 31 | 4 (0)| 00:00:01 | | 11 | BITMAP AND | | | | | | |* 12 | BITMAP INDEX SINGLE VALUE| OBS_FACT_PAT_NUM_BI | | | | | |* 13 | BITMAP INDEX SINGLE VALUE| OBS_FACT_CON_CODE_BI | | | | | ----------------------------------------------------------------------------------------------------------
Good Execution Plan (another example) • 2012-05-08_6613_jgreenwood.sql – Took 3 seconds (3800 seconds before) -------------------------------------------------------------------------------------------------------- | Id | Operation | Name | Rows | Bytes | Cost (%CPU)| Time | -------------------------------------------------------------------------------------------------------- | 0 | INSERT STATEMENT | | 1 | 410 | 6 (50)| 00:00:01 | | 1 | HASH GROUP BY | | 1 | 410 | 6 (50)| 00:00:01 | | 2 | TABLE ACCESS BY INDEX ROWID | OBSERVATION_FACT | 1 | 31 | 5 (40)| 00:00:01 | | 3 | NESTED LOOPS | | 1 | 410 | 5 (40)| 00:00:01 | | 4 | SORT UNIQUE | | 1 | 379 | 0 (0)| 00:00:01 | | 5 | TABLE ACCESS BY INDEX ROWID| CONCEPT_DIMENSION | 1 | 379 | 0 (0)| 00:00:01 | |* 6 | INDEX RANGE SCAN | CONCEPT_DIMENSION_PK | 1 | | 0 (0)| 00:00:01 | | 7 | BITMAP CONVERSION TO ROWIDS | | | | | | |* 8 | BITMAP INDEX SINGLE VALUE | OBS_FACT_CON_CODE_BI | | | | | --------------------------------------------------------------------------------------------------------
Oracle Table Statistics • We have several work tickets describing our efforts to improve performance • After tweaking table statistics based on Oracle documentation, we finally got statistics that resulted in good performance • Source code here: https://informatics.kumc.edu/work/browser/heron_load/oracle_table_stats.sql • Unfortunately, these same steps to not consistently result in good performance • Often, we end up migrating table statistics from one month to the next
Ongoing Frustrations: monthly table statistics migration • After our monthly ETL, we check the execution plan of a query we consider indicative of performance: 2012-04-27_6498_rwaitman.sql • If “bad” plans are generated, we try running table statistics: • https://informatics.kumc.edu/work/browser/heron_load/oracle_table_stats.sql • If this doesn’t result in good plans, we migrate stats from the previous month • Why are the plans not consistent given similar data and identical steps to generate stats?
Automated Tests Jenkins used to automate (links are internal only – we can take a closer look during the meeting) • Daily execution plan test: • http://localhost:8080/view/Performance%20Monitoring/job/heron_performance_check_plans/configure • Weekly performance test: • http://localhost:8080/view/Performance%20Monitoring/job/heron_performance_weekly/configure • We have 52 different distinct i2b2 queries. Some contrived and others taken from real users who experienced poor performance. • Tests run weekly (and manually occasionally). Some dating back to April of 2012. • A couple of key performance tests follow – these are a couple we’ve used to be an indicator of poor overall performance
References • HERON Wiki Page • https://informatics.kumc.edu/work/wiki/HERON • Heron ETL Wiki Page (HeronLoad) • https://informatics.kumc.edu/work/wiki/HeronLoad