Download
1 / 8
90 likes | 645 Vues
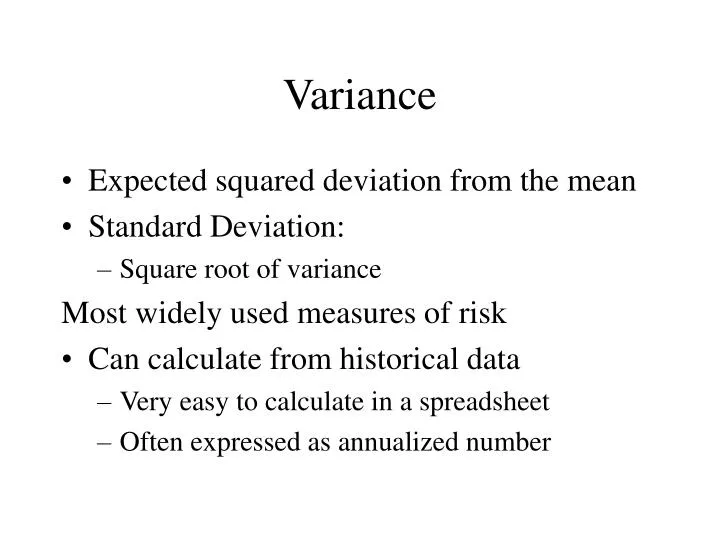
Variance. Expected squared deviation from the mean Standard Deviation: Square root of variance Most widely used measures of risk Can calculate from historical data Very easy to calculate in a spreadsheet Often expressed as annualized number. How to calculate variance.

E N D
Variance • Expected squared deviation from the mean • Standard Deviation: • Square root of variance Most widely used measures of risk • Can calculate from historical data • Very easy to calculate in a spreadsheet • Often expressed as annualized number
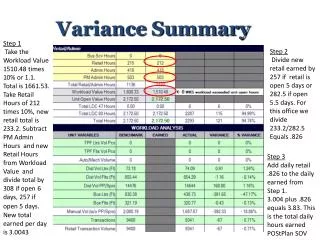
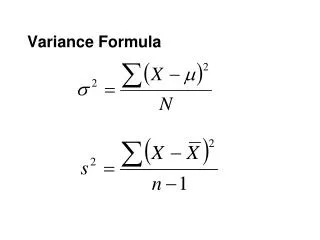
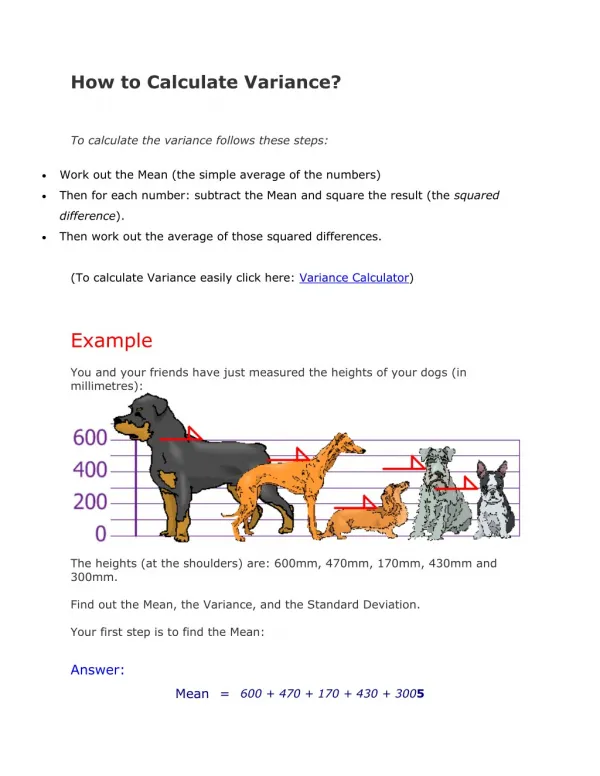
How to calculate variance • Calculate returns each period • Daily, Weekly, or Monthly • Find the average return • Sample mean, CAPM expected return, or Zero • For each period, calculate difference between realized return and expected return • Square them, sum, and divide by N-1 • Or, just use spreadsheet function VAR
How to calculate variance • Alternative Formula
Calculating Standard Deviation • Calculate Variance • Take the Square Root • Or use spreadsheet function STDEV
Annualize • To annualize variance: • For monthly data, multiply by 12 • For weekly data, multiply by 52 • For daily data, multiply by 252 • To annualize standard deviation • Multiply by square root of 12, 52 or 252
Volatility • The annualized standard deviation of returns is sometimes called “Volatility”
Drawbacks • Variance does not give the whole picture • Skewness may be important • Variance treats large negative events the same as large positive ones
Scenario Analysis • Specify hypothetical outcomes • Assign probability distribution • Example: Insurance company • Example: Corporate bond