Download
1 / 23
230 likes | 403 Vues
Linking physical habitat characteristics to Chinook spawning distribution in the Yakima River Jeremy Cram 1 , Christian Torgersen 2 , Ryan Klett 1 , George Pess 3 , Andrew Dittman 3 , Darran May 3 1. University of Washington, College of Forest Resources, Seattle, WA 98195 USA

E N D
Linking physical habitat characteristics to Chinook spawning distribution in the Yakima River Jeremy Cram1, Christian Torgersen2, Ryan Klett1, George Pess3, Andrew Dittman3, Darran May3 1. University of Washington, College of Forest Resources, Seattle, WA 98195 USA 2. U.S. Geological Survey, Forest and Rangeland Ecosystem Science Center, Cascadia Field Station, University of Washington, College of Forest Resources, Seattle, WA 98195 USA 3. NOAA Northwest Fisheries Science Center, 2725 Montlake Boulevard East, Seattle, Washington 98112, USA
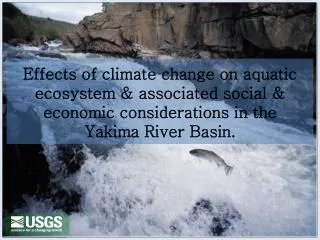
Yakima River • Habitat degradation: • Dams and irrigation canals • Bank armoring • High temperatures in downstream reaches • Invasive species • Restoration action: • Supplementation in 1997 • Acclimation facilities to extend spawning distribution
Objectives • Develop and evaluate extensive survey methods for lotic habitat and fishes • Relate physical habitat to spawning site selection and homing by wild- and hatchery-origin salmon • Link community structure of resident fishes to habitats associated with salmon spawning distribution
Methods • Extensive habitat and snorkel survey (2007) • Intensive survey (2008) • Carcass and redd surveys (2002 – 2008) • Depth and temperature profiling (2009)
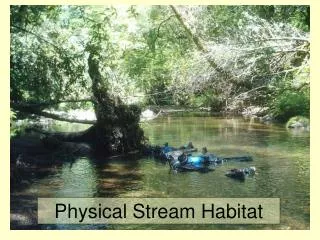
Extensive survey September 2007 flow • Channel type (1,2,3) • Unit type (PO,GP,GR, RI) • Channel width • Depth • Substrate • Cover • Wood • Fish abundance 125 m Survey summary
Intensive survey September – October 2008 flow • Gradient • Temperature • Conductivity • Velocity 125 m Survey summary
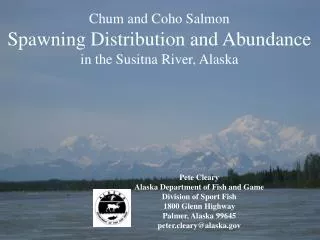
Carcass and redd surveys (2002 – 2008) 2007 Redds • Surveys conducted by Yakama Nation and NOAA Fisheries • GPS location • Origin (CWT) • Gender • Age class • Length 2002-2008 Redds flow 125 m
2009 (winter) – temperature and depth profiling flow • Near-bottom depth and temperature logged every 2 seconds • Merged with GPS tracklog based on time stamp 125 m
Preliminary results • Extensive habitat and snorkel survey (2007) • Intensive survey (2008) • Carcass and redd surveys (2002 – 2008) • Depth and temperature profiling (2009)
1 km 2 km 4 km Density (wild female carcasses/km) Density (hatchery female carcasses/km) Distance upstream (km)
1 km 2 km 4 km Density (redds/km) Density (side channels/km) Distance upstream (km)
1 km 2 km 4 km Density (redds/km) Boulder Fines Bedrock Acclimation site % Poor substrates % Gravel Distance upstream (km)
1 km 2 km 4 km Density (redds/km) Density (rainbow trout/km) Distance upstream (km)
16 redds in 2007/8 15:30:00 15:32:30
(16 %) (25 %)
Preliminary conclusions • Hatchery- and wild-origin Chinook have similar spawning distributions at scales ≥ 1km • The influence of habitat factors on spawning site selection depends on spatial scale • Redd density is correlated with rainbow trout distribution at broad scales (4 km)
Acknowledgments • Logistics and GIS: Darran May, Hiroo Imaki, Ethan Welty, John Vaccaro, Patricia Haggerty • Housing and support: everyone at the Cle Elum supplementation and research facility • Funding: NOAA BiOP, The Water Center • Photography: Ethan Welty • Aerial photos: NAIP – Allyson Jason • LiDAR – Robert Hilldale
What’s next? • Data analysis • Extensive • Intensive • Temperature/depth profile • Redd/carcass distribution • Lidar
1 km 2 km 4 km Density (redds/km) % cover Mean wet width (m) Distance upstream (km)
Background Redds 2007 Cle Elum R. Hatchery Acclimation site Density (redds/km) Teanaway R. Acclimation site Distance upstream (km)