Download

1 / 23
230 likes | 363 Vues
DNA-Based Pedigree Analysis of Chinook Salmon from the Yakima River. Todd W. Kassler, Scott M. Blankenship, Kenneth I. Warheit, and Craig A. Busack Washington Department of Fish and Wildlife. Yakima Basin Science and Management Conference June 16-17, 2010. Background.

E N D
DNA-Based Pedigree Analysis of Chinook Salmon from the Yakima River Todd W. Kassler, Scott M. Blankenship, Kenneth I. Warheit, and Craig A. Busack Washington Department of Fish and Wildlife Yakima Basin Science and Management Conference June 16-17, 2010
Background • Joint project between WA Department of Fish and Wildlife • (WDFW) and Yakama Nation (YN) • Project objective is to assess the relative reproductive success • of Chinook in the upper Yakima River • Collection of hatchery-origin adult males and females, jacks, • and precocious male Chinook occurred at Roza Dam from • 2003 – 2006 • Collection of both hatchery- and natural-origin Chinook has • occurred from 2007 - present • Genetic analysis using microsatellite DNA loci is used to • determine parentage. Methodology used for the analysis is the • same as we have used for the Cle Elum spawning channel
Laboratory Methods • DNA was extracted from fin tissue • PCR amplification was performed using microsatellite loci • Amplified products were run through an ABI-3730 Genetic Analyzer • Electropherograms were scored using GENEMAPPER software v.3.7 • Data was binned using GAPS allele naming
Laboratory Methods • DNA was extracted from fin tissue • PCR amplification was performed using microsatellite loci • Amplified products were run through an ABI-3730 Genetic Analyzer • Electropherograms were scored using GENEMAPPER software v.3.7 • Data was binned using GAPS allele naming
Laboratory Methods • DNA was extracted from fin tissue • PCR amplification was performed using microsatellite loci • Amplified products were run through an ABI-3730 Genetic Analyzer • Electropherograms were scored using GENEMAPPER software v.3.7 • Data was binned using GAPS allele naming
Laboratory Methods • DNA was extracted from fin tissue • PCR amplification was performed using microsatellite loci • Amplified products were run through an ABI-3730 Genetic Analyzer • Electropherograms were scored using GENEMAPPER software v.3.7 (~40,000 individual electropherograms) • Data was binned using GAPS allele naming
Laboratory Methods • DNA was extracted from fin tissue • PCR amplification was performed using microsatellite loci • Amplified products were run through an ABI-3730 Genetic Analyzer • Electropherograms were scored using GENEMAPPER software v.3.7 • Data was binned using GAPS allele naming
Locus Data N N parents Locus Alleles Genotyped Ho He Excl (1) Excl (2) Ogo-2 11 2,186 0.825 0.821 0.475 0.648 Ogo-411 2,188 0.801 0.806 0.456 0.632 Oki-100 26 2,117 0.919 0.904 0.682 0.811 Omm-1080 44 2,162 0.937 0.961 0.852 0.920 Ots-201b 29 2,118 0.915 0.904 0.679 0.809 Ots-208b 29 2,115 0.930 0.941 0.787 0.880 Ots-211 28 2,123 0.930 0.931 0.757 0.861 Ots-212 24 2,182 0.887 0.887 0.631 0.774 Ots-213 29 2,185 0.921 0.936 0.769 0.869 Ots-3M 9 2,185 0.652 0.651 0.254 0.435 Ots-9 6 2,186 0.678 0.656 0.237 0.400 Ots-G47413 2,190 0.362 0.367 0.072 0.211 Ssa-197 25 2,180 0.902 0.906 0.683 0.812 Ssa-40827 2,160 0.728 0.916 0.709 0.830 Excl (1) = Exclusionary ability of the locus when neither parent is known Excl (2) = Exclusionary ability of the locus when one parent is known
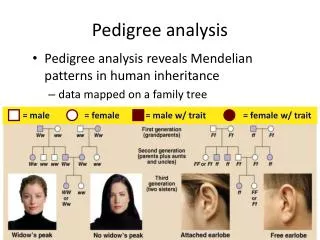
Evaluation of Parentage Assignments • Maximum likelihood parentage assignments performed with the program CERVUS 3.0 • Assignments for offspring were calculated for the most likely male and female parent pair. The parent pair assignment with two mismatches or less was accepted • Individuals that did not assign to a parent pair were then analyzed for a female parent only and male parent only (assignments with zero or one mismatches were accepted)
Causes of Mismatching • Germ-line mutation – a parent passes a changed allele to their • offspring (sequence or allele changes during replication) • PCR error (or process error) – error introduced by poor • amplification from lower quality DNA extracts • Genotyping error – inadvertent human error and computer • software error in scoring due to multiple peaks being selected
Electropherogram – Oki-100 Male 03GO - 0004 161 157 Female 03GO - 0005 184 161 Offspring 04EX - 0117 161 157 Offspring 04EX - 0118 161 184
Mismatching Oki-100 Ots-3M Ots-213 Female – 1 Female – 2 Male –1 Male – 2 Offspring – 1 Offspring – 2 Offspring – 3 100/100 100/100 100/100 200/200 200/200 200/200 120/120 120/120 120/120 240/240 240/240 240/240 100/120 100/120 100/120 200/240 200/240 200/240 100/120 100/120100/240
Expected proportion - Hatchery- and Natural-origin Chinook in 2007 return • 2,284 – Hatchery-origin Chinook count at Roza Dam • 1,558 / 1,147 – Natural-origin Chinook count at Roza Dam • (411 – Natural-origin Chinook brood) • 2,284 / 3,431 = 0.6657 – P ; 1,147 / 3,431 = 0.3343 – Q • 44.3% Hatchery-origin (H X H) – P2 • 44.5% Hatchery & Natural-origin (H X N & N X H) – 2PQ • 11.2% Natural-origin (N X N) - Q2
Observed returns - Hatchery- and Natural-origin Chinook • 229/ 1,153 offspring were assigned parental pair • Hatchery X Hatchery (19.9%) • 443 / 1,153 offspring were assigned a mother only • Hatchery X Natural (38.4%) • 163 / 1,153 offspring were assigned a father only • Natural X Hatchery (14.1%) • 318 / 1,153 offspring did not assign a mother or father • Natural X Natural (27.6%)
Comparison of Expected and Observed Percentages of Hatchery and Natural-Origin Chinook Expected Observed H X H 45.0%19.9% H X N & N X H 44.0%52.5% N X N 11.0%27.6%
Conclusions • Preliminary data – • Still need to calculate assignment errors • (probability of assigning incorrect parent) • Estimate significance of the assignments • The number of observed natural-origin Chinook is higher than expected • The number of observed hatchery-origin Chinook is lower than expected • More hatchery-origin females assigned as a parent than hatchery-origin • males
Future Work • Statistical analysis of 1999 and 2000 brood to determine an error rate for • calculating N X N offspring in the 2007 and 2008 collections • Analysis of 2004 adults (completed this year) • Analysis of 2008 offspring (scheduled for this upcoming year) • Analysis of third generation (2011 and 2012 returns)
Acknowledgements • BPA funds for the YKFP supported this work effort • Mark Johnston and crew from the Yakama Nation at Roza Dam • for collecting samples • Jennifer Von Bargen for all laboratory analysis