Download

1 / 16
860 likes | 2.36k Vues
Discrete and Continuous Variables. Section 6.1A. Warm-up. Find the least squares regression line: What would you predict for Test 2 if a person made a 80 on Test 1? What percent of variation in Test 2 can be explained by the least squares regression between Test 1 and Test 2?.

E N D
Discrete and Continuous Variables Section 6.1A
Warm-up • Find the least squares regression line: • What would you predict for Test 2 if a person made a 80 on Test 1? • What percent of variation in Test 2 can be explained by the least squares regression between Test 1 and Test 2?
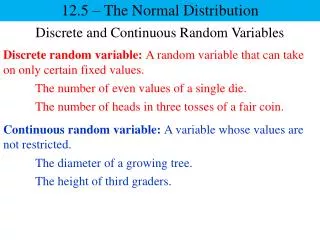
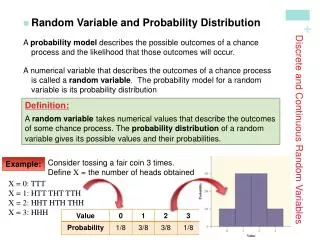
Random Variable • Numerical variable whose value depends on the outcome in a chance experiment. • It connects a numerical value with each outcome.
Two types of numerical data • Discrete – collection of isolated points. Can be counted. • Continuous – includes an entire interval. Can be measured.
Identify as Discrete or Continuous. • The number of desks in the room. • The average height of all students. • The price of gasoline.
Examples of random variables. • # of keys on a key chain: 0, 1, 2, 3, … • # of heads when 2 coins are tossed: 0, 1, 2
What is the random variable and what type of variable is it? • Social worker involved in study about family structure – finds the number of children per family. • Archer shoots arrows at the bull’s eye and measures the distance from the center to the arrow.
Probability distribution • Model that represents the long-run behavior of the variable. • Gives the probability associated with each possible x-value. • Can be graphed as well.
Ex: A box contains 4 slips of paper with $1, $1, $10, $20 on them. The winner of a contest selects 2 slips and gets the sum of the 2 as her prize. Let x = possible amount won.
We know that 10% of people who purchase cars buy manual transmissions and 90% purchase automatics. Three people purchase a car. Find the probability distribution for the number who purchase automatics.
35% of children wear contacts. Find the probability distribution for the number wear contacts in a group of four.
Properties of Probability Distribution • For every possible x value, • The sum of all possible probabilities is equal to 1.
Let x = # defects out of a lot of 10 parts Find P(exactly 4) Find P(at least 8) Find P(at most 2) Find P(more than 6) Find P(4<x≤6)
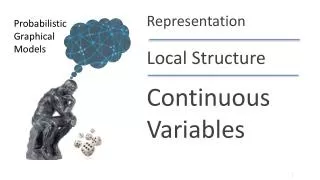
Continuous Random Variables • Represented by Density Curves • Area under the curve = 1 • P(x<.3) = P(x≤ .3) • Also Normal Distributions
Homework • Page 353 (1- 7) odd, (21, 23, 27, 33, 34)