Download

1 / 35
360 likes | 455 Vues
Learn about the origins of the binomial coefficient, its application in distinguishing ordered and unordered samples, the binomial distribution, mean, variance, and comparisons. Explore practical examples and understand how to calculate cumulative probabilities.

E N D
Where does the binomial coefficient come from? Suppose I 7 blue and pink balls, each of them uniquely marked so that I can distinguish them A B C D E F G How many different samples can I draw containing the same balls but in a different order? 7! I have 7 choices for the first spot, 6 choices for the second (since I’ve picked 1 and now have only 6 to choose from), 5 choices for the third, etc. 7! = 7 * 6 * 5 * 4 * 3 * 2 * 1 G E C D B F A
Now if I am just counting the number of blue and pink balls, I don’t care about the order. So all possible arrangements (3!) of the pink balls look the same to me A B F D E C G A B G D E C F A B E D F C G A B D C A B G D F C E A B E D G C F A B F D G C E So instead of having 7! combinations, we have 7!/3! combinations, because where before we had 6 different possibilities of uniquely ordering different pink balls – they are equivalent
E F G The same goes for the blue balls, if we can’t tell them apart, we lose a factor of 4! number of ways of arranging n different things Binomial coefficient =C(n,k)= ----------------------------------------------------------------- (# of ways to arrange k things)*(# ways to arrange n-k things) n! = ----------------- k! (n-k)! Note that the binomial coefficient is symmetric – there are the same number of ways of choosing k or n-k things out of n
We’ve got the coefficient, what is the distribution about? • Suppose your sample of 7 is actually drawn from a very large population • (so large that it is basically unaffected by the removal of a measly 7 balls) • p = probability that ball is pink • (1-p) = probability that ball is not pink (blue) • The probability that you draw a sample with 3 pink balls and 4 blue balls in a particular order e.g. (two pink followed by 3 blues, followed by a pink followed by a blue) is prob(pink)*prob(pink)*prob(blue)*prob(blue)*prob(blue)*prob(pink)*prob(blue) = p3*(1-p)4
We’ve got the coefficient, what is the distribution about? • But the binomial distribution just tells us what the probability is of drawing e.g. 3 pink balls, not 3 pink balls at a particular point in the draw • The probability that you draw a sample with 3 pink balls and 4 blue balls in no particular order is = C(7,3) p3*(1-p)4 + ….
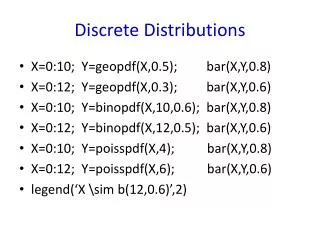
Probability distribution • A probability distribution lists all the possible outcomes and their probabilities • Outcomes are mutually exclusive • e.g. drawing 0, 1, 2, 3… pink balls • Outcome probabilities sum to one • e.g. when drawing 7 balls, the probability has to be one of {0,1,2,3,4,5,6,7} • Denote p(x) to mean P(X=x), that is the probability that the outcome is x
Binomial distribution • The binomial distribution tells us the probability of drawing k pink balls out of n • It depends on • n = the number of trials (draws) • k = the number of pink balls (successes) • p = the probability of drawing a pink ball (success)
the binomial distribution in R • dbinom(x, size, prob) • if blue and pink balls are equally likely > dbinom(3,7,0.5) [1] 0.2734375 >barplot(dbinom(0:7,7,0.5),names.arg=0:7)
what if p ≠ 0.5? • > barplot(dbinom(0:7,7,0.1),names.arg=0:7)
What is the mean? • mean of a binomial distribution is just n*p • in general = E(X)= xp(x) probabilities that sum to 1 0.25 0.20 0.15 0.10 0.05 0 * + 1 * + 2 * + 3 * + 4 * + 5 * + 6 * + 7 * 0.00 m = 3.5
What is the variance? • variance of a binomial distribution is justn*p*(1-p) • in general s2 = E[(X-m)2]= (x-m)2 p(x) (0.5)2 * (-0.5)2 * probabilities that sum to 1 0.25 0.20 (1.5)2 * 0.15 (-1.5)2 * 0.10 (-2.5)2 * (2.5)2 * 0.05 (-3.5)2 * (-3.5)2 * + + + + + + + 0.00
Which distribution has greater variance? p = 0.1 p = 0.5 var = n*p*(1-p) = 7*0.5*0.5 = 7*0.25 var = n*p*(1-p) = 7*0.1*0.9=7*0.09
briefly comparing an experiment to a distribution experiments = 1000 tosses = 7 for (i in 1:experiments) { x = sample(c("H","T"), tosses, replace = T) y[i] = sum(x=="H") } hist(y,breaks=-0.5:7.5) lines(0:7,dbinom(0:7,7,0.5)*1000) theoretical distribution result of 1000 trials Histogram of y 300 250 200 150 Frequency 100 50 0 0 2 4 6 y
cumulative distribution • aka CDF = cumulative density function • the probability that x is less than or equal to some value a
cumulative distribution P(X=x) P(X≤x) > barplot(dbinom(0:7,7,0.5),names.arg=0:7) > barplot(pbinom(0:7,7,0.5),names.arg=0:7)
cumulative distribution 1.0 1.0 0.8 0.8 0.6 0.6 cumulative distribution probability distribution 0.4 0.4 0.2 0.2 0.0 0.0 0 1 2 3 4 5 6 7 0 1 2 3 4 5 6 7 P(X=x) P(X≤x)
example: surfers on a website • Your site has a lot of visitors 45% of whom are female • You’ve created a new section on gardening • Out of the first 100 visitors, 55 are female. • What is the probability that this many or more of the visitors are female? • P(X≥55) = 1 – P(X≤54) = 1-pbinom(54,100,0.45)
another way to calculate cumulative probabilities • ?pbinom • P(X≤x) = pbinom(x, size, prob, lower.tail = T) • P(X>x) = pbinom(x, size, prob, lower.tail = F) > 1-pbinom(54,100,0.45) [1] 0.02839342 > pbinom(54,100,0.45,lower.tail=F) [1] 0.02839342
female surfers visiting a section of a website what is the area under the curve?
cumulative distribution > 1-pbinom(54,100,0.45) [1] 0.02839342 <3 %
Another discrete distribution: hypergeometric • randomly draw n elements without replacement from a set of N elements, r of which are S’s (successes) and (N-r) of which are F’s (failures) • hypergeometric random variable x is the number of S’s in the draw of n elements
hypergeometric example • fortune cookies • there are N = 20 fortune cookies • r = 18 have a fortune, N-r = 2 are empty • What is the probability that out of n = 5 cookies, s=5 have a fortune (that is we don’t notice that some cookies are empty) • > dhyper(5, 18, 2, 5) • [1] 0.5526316 • So there is a greater than 50% chance that we won’t notice.
hypergeometric and binomial • When the population N is (very) big, whether one samples with or without replacement is pretty much the same • 100 cookies, 10 of which are empty binomial hypergeometric number of full cookies out of 5
code aside > x = 1:5 > y1 = dhyper(1:5,90,10,5) > y2 = dbinom(1:5,5,0.9) > tmp = as.matrix(t(cbind(y1,y2))) > barplot(tmp,beside=T,names.arg=x) hypergeometric probability binomial probability
Poisson distribution • # of events in a given interval • e.g. number of light bulbs burning out in a building in a year • # of people arriving in a queue per minute • l = mean # of events in a given interval
Example: Poisson distribution • You got a box of 1,000 widgets. • The manufacturer says that the failure rate is 5 per box on average. • Your box contains 10 defective widgets. What are the odds? > ppois(9,5,lower.tail=F) [1] 0.03182806 • Less than 3%, maybe the manufacturer is not quite honest. • Or the distribution is not Poisson?
Poisson approximation to binomial • If n is large (e.g. > 100) and n*p is moderate (p should be small) (e.g. < 10), the Poisson is a good approximation to the binomial with l = n*p binomial Poisson 0.15 0.10 0.05 0.00 0 1 2 3 4 5 6 7 8 9 11 13 15
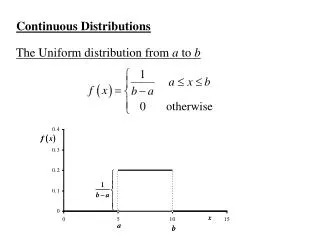
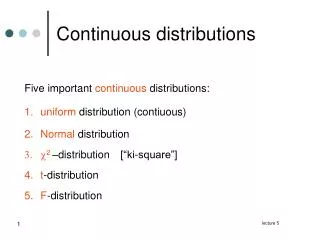
Continuous distributions • Normal distribution (aka “bell curve”) • fits many biological data well • e.g. height, weight • serves as an approximation to binomial, hypergeometric, Poisson • because of the Central Limit Theorem (more on this later) is important to inference problems
sampling from a normal distribution x <- rnorm(1000) h <- hist(x, plot=F) ylim <- range(0,h$density,dnorm(0)) hist(x,freq=F,ylim=ylim) curve(dnorm(x),add=T)
plotting on log axes • First of all, this is what a log function looks like > x = 1:1000 > y = log(x) > plot(x,y) y = log(x) is equivalent to x = exp(y) = ey
plotting the function y = e-x • > x = 1:20 • > y = exp(-x) • > plot(x,y) hard to tell what’s going on here, all the values are so close to 0
changing the axes just y on a log scale both x and y on a log scale > plot(x,y,log="y") > plot(x,y,log="xy")