Download
1 / 28
280 likes | 384 Vues
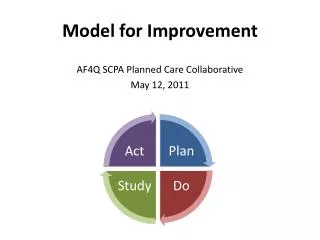
Information for Improvement. Mark Limber Carol Limber. Systems Thinking. Harnessing and Sharing Data. DATA CLOUD. Performance Clinical Outcomes Etc. Contract Management Budget Forecasts Disease Prevalence Etc. Activity Performance Budget Etc. Health Records Self Care

E N D
Information for Improvement Mark Limber Carol Limber
Harnessing and Sharing Data DATA CLOUD Performance Clinical Outcomes Etc Contract Management Budget Forecasts Disease Prevalence Etc Activity Performance Budget Etc Health Records Self Care Patient Choice Etc PATIENTS PURCHASER CLINICAL PROVIDERS Commissioning Cycle
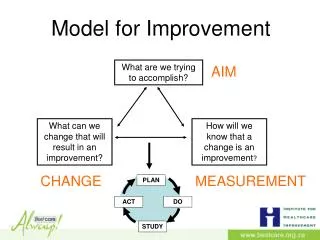
Establishing Indicators for Quality Improvement • Robust standardised indicators • Allow you to benchmark and measure quality • Help local clinical teams select relevant indicators for quality improvement • Encourages clinical teams to work together to improve services
Central & Consistent • Benchmarking is only possible if; • Definitions are agreed • Data is consistent • Data is available in one place
Secondary Uses Service (SUS) • Data warehouse that provides access to anonymous patient-based data for purposes other than direct clinical care such as: • healthcare planning • commissioning services • public health • national policy development • Fed via national minimum datasets
Business Intelligence "the ability to understand the interrelationships of presented information in such a way as to guide action towards a desired goal” Hans Peter Luhn – IBM 1958
Application of Intelligence Risk stratification Ambulatory care index Geo profiling Disease trends Health outcomes Cost of healthcare Management costs Service line reporting KPI Who are my high cost patients? Urgent care dashboards Tracking individual pathways of care
Inpatient Spells by Treatment Function Code This box shows the overall growth figure for the PCT PCT Difference to expected2 2008/9 & 2009/10 Number of spells Growth % TFC Area SHA 90993 2.0% Total E Non-E 89224 The ‘Rest’ ‘The rest’1 38.5 50.8 -26.1 13.0 Mental Health Mental Health 4.4 -20.0 4.7 0.1 Geriatric -11.4 -43.8 -11.3 -9.1 Geriatric Obs & Gynae 0.0 -3.8 0.7 -1.4 Obs & Gynae -9.6 0.0 -9.6 This section shows the percentage growth in number of spells by Treatment Function Code in total, for elective and non-elective and compares to the SHA average growth -17.1 Neonates & AnteN Blood disorders 2.8 2.4 19.8 3.7 Neonates/AnteN Blood disorders This graph shows the number of Spells by Treatment Function Code ‘roll-up’for two years This graph shows the difference to expected number of spells for each Treatment Function Code area for each of the two years General Medicine -24.1 -23.6 -24.3 -0.2 General Medicine Anaest& PM 0.2 -0.3 20.8 16.5 Anaest & PM A&E -1.2 n/a -1.2 3.9 A&E Paediatrics -2.9 -5.6 -2.1 -1.2 Paediatrics Cardio& Vascular 141.2 89.8 171.9 9.6 Cardio & Vascular 8.4 15.6 -13.2 3.2 Neurosciences Ophthalmology Neurosciences 15.1 15.0 27.3 3.3 -4.2 2.6 1.8 10.2 ENT Ophthalmology ENT Orthopaedics 5.4 6.6 2.1 3.3 Orthopaedics 11.6 2.5 288.6 10.7 Digestive Tract Digestive Tract Skin, Breast Burn 1.9 0.7 8.2 3.4 Skin, Breast Burn Urology 0.2 1.0 -7.4 3.8 Urology General Surgery 2.7 3.1 2.4 1.8 General Surgery 2008/9 2009/10 1 The ‘Rest’ includes TFCs covering Endocrine, Hepato-Biliary, Dermatology and Other 2 Expected is calculated from the Standardised Admission Ratios’ by Treatment Function Code Source: Dr Foster, IHSS Team analysis
Finance Breakdown Shows source of overspend
KPIs Aggregated Performance Indicators by month Drill down ability for each Performance Indicator Tracking QOF / CQUIN targets and performance
Emergency TTT Number of Patients 4Hrs Breaches Time to Treatment
Google Data Prevalence of flu related searches in NZ
Google Data Prevalence of flu related searches in NZ Actual incidents of flu in NZ
Summary • 4 ‘C’s for DATA; • Central • Consistent • Complete • Correct • 3 ‘M’s for INDICATORS; • Measurable • Meaningful • Mandatory
More advice…. Perfect = Complacent Think big, start small Take the users with you- What's in it for me? Be flexible; It wont be right first time Don’t let security worries stop innovation- Manage the risk sensibly
Finally…. On England choosing an all black strip for the Rugby World Cup; “its like drawing abs on your beer belly with a marker pen ….. You’re not really fooling anyone” -Twitter July 2011