Download
1 / 35
360 likes | 665 Vues
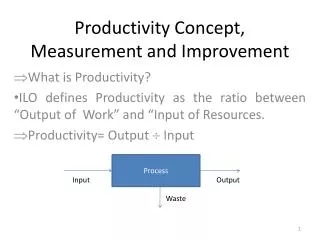
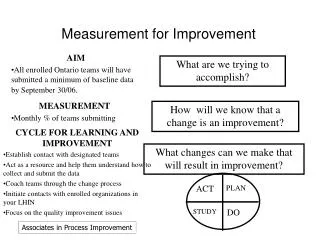
Measurement for improvement. Mike Davidge. Measurement for improvement. “ Measurement is for improvement not judgement .” D. Berwick. Model for Improvement. 7 Steps to measurement. 1 Decide aim. 2 Choose measures. 3 Define measures. 7 Repeat steps 4-6. 6 Review measures.

E N D
Measurement for improvement Mike Davidge
Measurement for improvement “Measurement is for improvement not judgement.”D. Berwick
7 Steps to measurement 1 Decide aim 2 Choose measures 3 Define measures 7 Repeat steps 4-6 6 Review measures 4 Collect data 5 Analyse & present
Measures checklist – a handy reminder • Section 1 • Rationale • Definitions • Data required • Goals • Section 2 • Collect • Analyse • Review
Clarifying aim is crucial 1 Decide aim 2 Choose measures 3 Define measures Take the LIFT test. Would you be able to describe your aim in a couple of sentences? Take 5 minutes to agree your aim 7 Repeat steps 4-6 6 Review measures 4 Collect data 5 Analyse & present
Choosing the right measures 1 Decide aim 2 Choose measures 3 Define measures 7 Repeat steps 4-6 6 Review measures 4 Collect data 5 Analyse & present
Types of measure • Outcome measures • Reflect the impact on the patient • For example: unplanned return to ITU or crash calls. • Processmeasures • Reflect the way you work • For example: % compliance with Sepsis 6 bundle. • Balancingmeasures • reflect unintended consequences • For example: if you have implemented changes to reduce your post operative length of stay, you also want to know what is happening to your post operative readmission rate. If this has increased then you might want to question whether, on balance, you are right to continue with the changes or not.
Driver diagram SECONDARY DRIVERS AIM PRIMARY DRIVERS • Timely triage • Timely notification to, and assessment by nurse and doctor • Early and repeated lactate measurements • Monitoring and communication of progress To improve recognition and timely management of patients identified with sepsis in ED and CDU by achieving 90% compliance with evidence based therapy (SEPSIS 6) by March 2013 Early identification of patients with possible sepsis in ED, CDU and Wards 1 1 • Early aggressive administration of IV fluids • IV antibiotics administered within 1 hour • Blood cultures taken before IV antibiotics are given • Education of staff in sepsis as time critical illness 2 Ensure sepsis best management practices in ED, CDU and wards 2 • Effective communication between ED , CDU and SCAS • Effective communication and transition with in-patient wards • Patient shadowing and information for patients 3 Seamless transitions
Choose your measures Use the driver diagram You have 5 minutes to customise to your system Now take another 5 minutes to decide which drivers and change ideas to measure Homework: Continue to discuss!
Definitions – an Achilles heel 1 Decide aim 2 Choose measures 3 Define measures 7 Repeat steps 4-6 6 Review measures 4 Collect data 5 Analyse & present
Collect Decisions, decisions • What - All patients or a sample? • Who – is collecting? • Where – is the data located? • How – hospital system or audit? • When – Real time or retrospective? What is your baseline? 1 Decide aim 2 Choose measures 3 Define measures 7 Repeat steps 4-6 6 Review measures 4 Collect data 5 Analyse & present
14 Where to measure? Start ? Decision Point ? Handover ? End ?
It’s not an add-on Organise everything around value-added (front line) work processes W Edwards Deming All value-adding work is inherently local; All improvement is inherently local; therefore, As you implement a data collection system, You mustn't destroy clinical productivity Instead, you must Integrate data collection into workflow at the front line
Admission and Recognition Bundles • Detail actions that should take place on a regular, routine basis such as: • Observations • Calculating and recording NEWS score • Querying sepsis if the score is high • Communicating NEWS and risk to whole team • The aim is to embed these actions and behaviours into normal everyday practice • So a high compliance with these bundles is demonstration that practice is based upon the best available evidence
Planning & testing your data collection What, Who, When, Where and How? You have 5 minutes to discuss your data collection plan And decide your first small test of change (PDSA) Homework: Run the PDSA
Analyse “The type of presentation you use has a crucial effect on how you react to data” 1 Decide aim 2 Choose measures 3 Define measures 7 Repeat steps 4-6 6 Review measures 4 Collect data 5 Analyse & present
How we traditionally assess performance:2 point comparisons Why has the number of crash calls gone up? Our service is getting worse. We need to do something! What decision are you going to make?
In the real world, everything varies.... How many patients did we admit today? How long does it take you to get to work? Is my temperature always the same? How long does it take to take a patients BP?
“Data contains both signal and noise. To be able to extract information, one must separate the signal from the noise within the data.” Walter Shewhart
There are two types of variation We should display data in a way that shows which is present • While every process displays variation: • some processes display controlled variation (common cause) • Stable pattern of variation = noise • constant causes/ “chance” • while others display uncontrolled variation • pattern changes over time = signal • special cause variation/“assignable” cause eg infection or hypothermia
Revisiting Crash calls 2011 2012
Data from an in hours Outreach service During this time sepsis was a major contributor to death in 15% of cases
Review measures It is a waste of time collecting and analysing your data if you don't take action on the results 1 Decide aim 2 Choose measures Question 1 3 Define measures • Where will the measures be reviewed? 7 Repeat steps 4-6 6 Review measures 4 Collect data Question 2 • When (how frequently) will we review them? 5 Analyse & present
Where do you put stuff you want everyone to know? Why do we hide track and trigger scores at the foot of the bed and then audit them infrequently?
Putting Important Information In a Prominent Place Communicates to the whole team, all the time Quickly exposes where staff have difficulty with performing observations/calculating score Promotes education and training for possible eventualities
7 Steps to measurement • You may not get it right first time! You may need several attempts to get it right for you 1 Decide aim 2 Choose measures 3 Define measures 7 Repeat steps 4-6 6 Review measures 4 Collect data 5 Analyse & present
Next steps – the project plan • Measures • Do you have an agreed set of measures? If not, how and when will you get them agreed? • Definitions • Who will complete measures checklists for all remaining measures and by when? • Review meetings • Have you agreed when you will review your measures? Set a date for the first meeting • Test your process • When are you going to follow the 7 step process for your first measures? 1 Decide aim 2 Choose measures 3 Define measures 7 Repeat steps 4-6 6 Review measures 4 Collect data 5 Analyse & present