Download
1 / 38
390 likes | 537 Vues
Retrospective Denials Management. Weaving together the Clinical, Technical, and Legal Components Glen Reiner, RN, MBA, Western Region President. Goals for our time together today. Present an overview of effective Denials Management (DM) approach Discuss Key Performance Indicators – MAP Keys

E N D
Retrospective Denials Management Weaving together the Clinical, Technical, and Legal Components Glen Reiner, RN, MBA, Western Region President
Goals for our time together today • Present an overview of effective Denials Management (DM) approach • Discuss Key Performance Indicators – MAP Keys • Propose a composition of a successful DM team • Review of possible Denials Management processes and workflows • Examine importance of accurate data collection and analysis • Discuss Denials Management challenges
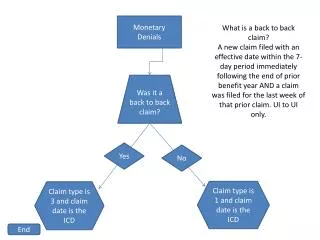
Define a Denial • What is a denial? Any Claim Paid Less than Expected • How do you calculate the dollar impact of a denial? “The Delta” The difference between the expected payment and the actual payment
Some of the keys to success include: • Systems that collect data and processes that translate that data into information • Front end processes to ensure eligibility, notification and authorization • Ongoing and timely clinical review and communication with payors • Contract management & IT systems that accurately calculate expected payments using complex reimbursement formulas • Integrated denials management for both technical and clinical
Overview of the Denials Management Process • Role of the Denials Management Team: Take responsibility for an assigned portion of a hospital’s accounts receivable, beginning with the identification of a clinical, technical or legal denial
Denials Management Team Composition • Diverse team of experts comprised of: • Project Management • Nurses & Medical Directors • Accounts Receivable/Billing Specialists • Inpatient/Outpatient Coders • Clerical Support Specialists • Legal Support • Considerations when building the team • Existing resources, reporting relationships • Corporate Partners
Seamless integration of business office and clinical audit operations is imperative • A process must be in place between “AR staff” and “clinical staff” – The Hand-off • Delivery of clinical denials to clinical staff (paper vs. electronic) • Nurse Audit request (explanation of problem) • RAs/EOBs/UBs • Medical records • Clinical audit inventory must be managed • Distribution to clinical staff - Prioritization methodologies • Productivity measurements • Clinical outcome reports
Denials Management Work Flow Model Adjust – Close Accept A/R Rep. Review Action Accept Technical Payment – Close Reconsideration, Appeal, Grievance * Denial Occurs A/R Rep. Review Follow Up Referral Clinical / Legal Action Adjust – Close Nurse Audit Accept * Referral to Legal as needed at any point
Denials Management Data • The data that is generated from the Denials Management process is [almost] as valuable as the additional revenue • This information can be used by the facility to focus concurrent CM and UR efforts as well as improve clinical and PFS functions
“Real Life” use of data • Concurrent review process moved into a centralized work flow system • Significant decrease in concurrent and retrospective denial activity • Created a “Case Management Command Center” within the Emergency Department • Used data then to prove it was working • Accurate denial data used to build a short stay rate advantageous to the hospital into contracts • Accounts aggregated for Joint Operating Committee review with payor
HFMA’s MAP Keys • Sets a national standard for revenue cycle excellence • Define the critical indicators of revenue cycle performance in clear, unbiased terms • Ensure consistent reporting • Each Key has a Purpose, Value and Calculation
Initial Denial Rate – Zero Pay • Purpose: Trending indicator of percentage claims not paid • Value: Indicates providers’ ability to comply with payer requirements and payer’s ability to accurately pay the claim Number of zero paid claims denied Number of total claims remitted
Initial Denial Rate – Partial Pay • Purpose: Trending indicator of percentage claims partially paid • Value: Indicates provider’s ability to comply with payer requirements and payer’s ability to accurately pay the claim Number of partially paid claims denied Number of total claims remitted
Denials Overturned by Appeal • Purpose: Trending indicator of hospital’s success in managing the appeal process • Value: Indicates opportunities for payer and provider process improvement and improves cash flow Number of appealed claims paid Total number of claims appealed and finalized or closed
Denial Write-Offs as a Percent of Net Revenue • Purpose: Trending indicator of final disposition of lost reimbursement, where all efforts of appeal have been exhausted or provider chooses to write off expected payment amount • Value: Indicates provider’s ability to comply with payer requirement and payers ability to accurately pay the claim Net dollars written off as denials Net patient services revenue
Ideally, data from denials should directly feed continuous improvement efforts Root cause analysis identifies opportunities for improvement and education, preventing future denials for the same reason Cause Cause Cause Details Details Details Details Details Details Details Details Details Main Topic Details Details Details Details Details Details Details Details Details Cause Cause Cause
Analysis of Denials Management root causes often reveal issues in multiple areas… • Prior Auth • Billing error • Wrong Insurance • Contract Coverage • Eligibility • Prior Auth Denials Health Plan Issues Denials Hospital Issues • Payment less • than expected • Non-covered • services • Concurrent • denials • Onsite review • Medical Director • LOS/Delay days • Not medically • necessary • Non covered service • Grievance/appeal • Process
Sample Denials Management Analysis • System wide, the areas not under the Hospital System’s immediate influence (Physician, Health Plan, and Patient) represented nearly 73% of the resolved denied claims: $6.5M of the total $8.6M • Front End and Back End combined represented just under 10% of the total number of resolved denied claims, and just under 9% of the dollars • The team had the most success appealing claims from the Health Plan Denial Area at 67% of total recovered dollars. The Physician Denial Area was a significant challenge with only 7% of total recovered dollars on all resolved claims • The Physician Denial Area had the largest number of resolved denied claims at each hospital
Sample Denials Management Analysis • At one hospital system an in-depth review demonstrated that the hospital had specific clinical issues… • Physician delay in discharge • Patients no longer meeting inpatient criteria and documentation insufficient to support continued stay • In cases where the patient is waiting for skilled nursing facility placement, roughly 40% of denied dollars were recovered on appeal/reconsideration • Overutilization of ICU • Short pays by health plans where the ICU level is not supported by documentation • On appeal 32% of denied dollars in this category related to Physician use of ICU were recovered
Tracking short pays over time identifies unwanted trends, but not always reasons
Sample Denials Management Results $26,170,509 in denied charges with a recovery rate of 54.05%
Closing The Loop: Example • By using the data to focus concurrent processes and drive educational efforts the Denials Management Team and the hospital were able to produce the following results: Recoveries from the Physician Denial area showed a dramatic increase (40%) • Concentrated education and document improvement effort • The fact that the recovery rate increased while the denial rate remained stagnant is an indication that the documentation improved, but the plan’s behavior is lagging behind
Specific Challenges: Emergency Dept Denials • Observation versus Inpatient • Inpatient cases where documentation does not support inpatient level of care • Many times are being paid $0.00 • Very difficult to appeal retrospectively with a valid inpatient order • Best place to catch these denials is at the time of admit • Denials Management data can be used to focus these efforts
Specific Challenges: Elective Surgery • Scheduled and authorized as outpatient, but made inpatient after the procedure • The chart contains an outpatient authorization, an inpatient order and the documentation supports outpatient level of care • These claims are either being short paid or paid at $0.00 • Very difficult to argue on appeal with out excellent documentation of complications • Addressing these concurrently requires excellent communication between Clinicians, Scheduling and Case Management • Consider documentation improvement program
Specific Challenges: Continuum Issues • Discharge to a lower level of care • Awaiting bed availability or placement • Possibility of partnering with appropriate alternative care facilities • Consider risk-sharing • Readmission Denials • The same or similar diagnosis • Can be technical and/or clinical issue
Specific Challenges: Use of “Criteria” • Published peer reviewed medical criteria • Opportunities with retrospective review • Use what fits the specific clinical reality • It Is Just Criteria • Careful review of payor contracts important, but as long as not contractually prohibited, use whatever works to build the case • First level appeals being upheld despite favorable criteria • Physician involvement • Clinical JOC meeting
Clinical Denials Management is an Essential Component of the Revenue Cycle • Prevents money from being left on the table • Provides great insight into process improvement opportunities • Requires specific, detailed processes and resource allocation • Systems for data analysis and comparison are crucial • Strong clinical integration is imperative
Denials Management imperative increases with ACA Revenue Cycle Imperatives *Illustration adapted from hfmap Revenue Cycle Excellence presentation on Reform impacts
What to Expect??? Follow the Money • More people being covered with less stringent requirements and processes • Focus on shift to lower levels of care • New payment methodologies and provider relationships • Expect more: • Clinical authorization requirements throughout care continuum • More concurrent and retrospective denials • Extensive, increased use of government audits
Remainder of the year: Almost like planning a new revenue cycle start-up • Will require strong collaboration between many in-and-outside the organization • Experts need to dedicated to closely stay abreast of developments as they occur, especially related to new Qualified Health Plans (QHP) • Focus on process definition as things become clearer • Establish strong mechanisms to collect, report and utilize data as new programs are implemented • Train, monitor, adjust and train some more
Adreima Contact Information Glen R. Reiner Western Region President Phone: (602)636-5530 - Cell: (602)373-3565 greiner@adreima.com Karl Hellerich Vice President of Business Development (Northeast) Phone: (732)296-0641 – Cell: (201)681-7706 khellerich@adreima.com
Excellence & Quality Community Honesty & Integrity Teamwork • Clinically-integrated Revenue Cycle Services • Client-Centered Service • Expertise • Extraordinary Culture • Professional Accountability • Principled Leadership • Compliance & Organizational Excellence Client-Centered Service Compassion & Caring Principled Leadership Affordability Innovation Unparalleled Expertise Extraordinary Culture Professional Accountability Community Honesty & Integrity Innovation Excellence & Quality Principled Leadership