Download
1 / 27
270 likes | 365 Vues
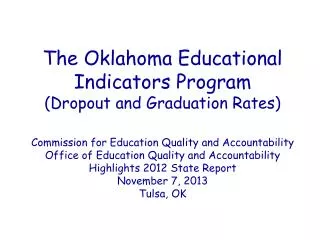
DRAFT. Oklahoma County Educational Indicators SYE 2008. Community Service Council. Prepared by the Community Service Council of Greater Tulsa, supported by the Metro Human Services Commission, May 2010

E N D
DRAFT Oklahoma County Educational Indicators SYE 2008 Community Service Council Prepared by the Community Service Council of Greater Tulsa, supported by the Metro Human Services Commission, May 2010 Data Source: Oklahoma State Department of Education, Data Services and Office of Accountability Profiles Reports.
Areas of Concern • High Dropout rate • High Attrition rate • Changes in performance test, and testing companies • Classification of students • Changes in calculating rates for dropouts and graduation
Quick Look at Student Performance: 3rd & 4th Grade Percent Receiving Satisfactory
Quick Look at Student Performance: 5th Grade Percent Receiving Satisfactory
Quick Look at Student Performance: 6th & 7th Grade Percent Receiving Satisfactory
Quick Look at Student Performance: 8th Grade Percent Receiving Satisfactory
Definitions Dropout rates • SYE 2005 and forward. Dropout rates calculated on a graduation class. [“Legal Dropouts”/(“Legal Dropouts” + Graduates)] * 100 • SYE 2001 through 2004. Dropout rates (calculated on a single year)=[Dropouts for the 9th, 10th, 11th, & 12th grade/9th through 12th grade fall enrollment] * 100 • SYE 1997 through 2000. Dropout rates (calculated on a single year)=[Dropouts for the 9th, 10th, 11th, & 12th grade/9th through 12th grade ADM]*100 * “Legal Dropouts” Dropout counts (under age 19 for the 9th, 10th, 11th, and 12th grades over the previous four year period, respectively).
Definitions Beginning SYE 2008 the graduation rate was calculated two different ways: • Average freshman graduation rate: Current graduated divided by the cohort of the average number of students in 8th, 9th, and 10th grades. For the current school year 2007-2008 this uses the cohort of 8th graders in 2003-2004, 9th graders in 2004-2005, and 10th graders in 2005-2006. Used in the State Profiles Report by the Office of Accountability. • Senior Graduation rate: Graduation rate = current year graduates/(current year graduates + dropouts for the 12th grade that same year). This method for calculation the senior graduation rate began for SYE 2005. Used in the District Profiles Report by the Office of Accountability. Graduation rates beginning SYE 2005-2007. • Graduation rate = [Current year graduates/(current year graduates + dropouts for the 12th grade)] * 100 Prior to SYE 1997-2005 – Graduation rate • Graduation rate = (Current number of graduates/9thgrade ADM 4 years earlier)*100
Average Daily Percent Absent Shaded areas are above Oklahoma County average percent absent by grade level.
Dropout rates-For school years ending 2001 through 2004 the number of dropouts below the age of 19 is divided by the fall enrollment. Beginning school year ending 2005, the Office of Accountability calculated a four-year high school dropout rate. The total number of dropouts for a graduating class was calculated by adding the dropout counts under age 19 for the 9th, 10th, 11th, and 12th grade over the previous four-year period, respectively. Then dividing by the sum of their graduates plus the legal dropouts. Due to a change in the calculation methods for the dropout rates the results are not comparable for the years prior to 2005 to the years after 2004.
Graduation rates.-Graduation rates are calculated by comparing the current number of graduates to the 9th grade student enrollment four years earlier. Beginning 2005 a Senior graduation rate was used, which divides current year graduated by current year graduates plus dropouts (under age 19) for the 12th grade that same year. Beginning SYE 2008 the current graduated is divided by the cohort of the average number of students in 8th, 9th, and 10th grades. Due to a change in the calculation methods for the graduation rate the results are not comparable for the years prior to 2005 to the years after 2004. Data points in red represent the change in calculating the graduation rates.