Download
1 / 65
650 likes | 791 Vues
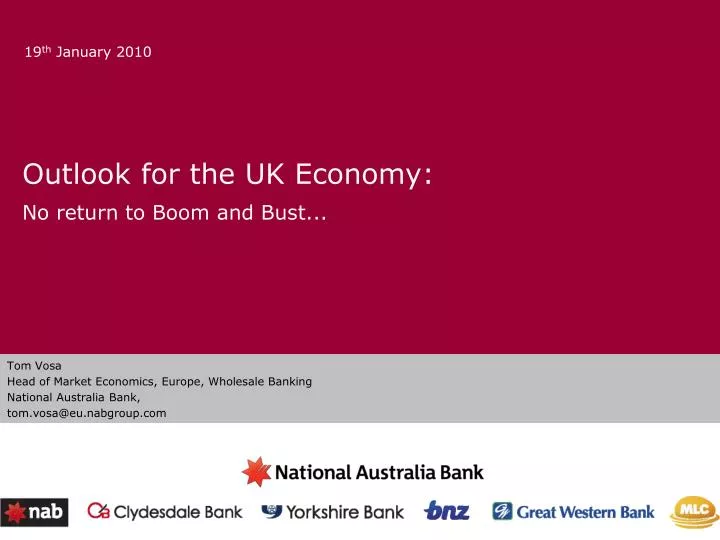
19 th January 2010. Outlook for the UK Economy: No return to Boom and Bust. Tom Vosa Head of Market Economics, Europe, Wholesale Banking National Australia Bank, tom.vosa@eu.nabgroup.com. UK macro outlook. UK is now the only G20 country still in recession.

E N D
19th January 2010 Outlook for the UK Economy: No return to Boom and Bust... Tom Vosa Head of Market Economics, Europe, Wholesale Banking National Australia Bank, tom.vosa@eu.nabgroup.com
UK is now the only G20 country still in recession • Not all countries suffered a recession during the global economic downturn • China, India, Australia and Saudi Arabia all avoided two consecutive quarters of negative growth • The table shows latest quarter’s GDP figures • Cumulative increase in GDP since each country’s respective trough would be greater than shown Indonesia South Korea Mexico China Brazil Russia Saudi Arabia Germany US Italy Canada India EU Japan France Turkey South Africa Australia Argentina UK -1 0 1 2 3 4 Source: Bloomberg
The fall in UK output is greatest in G7 after Japan Source: Bloomberg, National Australia Bank • The fall in output was greatest in the big exporting nations, Japan and Germany • They are now showing signs of life as global trade comes back on line • That leaves the UK as the only economy still in recession, at least according to official data
Even when the economy grows there should be plenty of slack £500billion • In 1979-81, output fell 4.9%. In 1990-92 it fell 2.5% and in 2008-09 it has fallen 6.0%. • Even on the Bank of England’s optimistic forecasts they will be plenty of excess capacity for many years • That should mean inflation won’t be problem for several years yet
But business surveys point to a return to growth in Q4 • Survey evidence suggests that we should see some growth in the fourth quarter. Though the surveys were not a good guide to Q3. • But with the recovery now on the way, what shape will it take?
Challenges for the UK economy in 2010 and beyond Can momentum be sustained? Can banks provide enough credit? Paying off the debt: Household Paying off the debt: Government
Challenges for the UK economy Can momentum be sustained? Can banks provide enough credit? Paying off the debt: Household Paying off the debt: Government
Currently the destocking cycle is providing a cyclical boost Source: ONS • Revisions to Q2 GDP left the economy falling by 0.2% against a preliminary estimate of a 0.4% fall. • Although destocking again detracted from growth in Q2, the size is much less than in earlier quarters.
But it is likely to prove short-lived • The unanticipated increase in stocks looks to be over. • However, stock cycles typically last only 6-9 months and can’t be relied on to deliver growth over the cycle.
...and schemes such as car scrapage won’t last forever • The car scheme has been very successful at boosting sales, though a large part of that goes on imports. • But even with the extra £100million it is unlikely to last until the original February deadline. • The scheme may have boosted consumer spending by 0.5% in Q3, though some of that went on imports.
The shape of UK economic recovery 2009-10? Q1 2009 -2.4% Q2 -0.6% Q3 -0.2% Q4 +0.5% Q1 2010 +0.2% Q2 +0.2% Q3 +0.3% Q4 +0.4%
Challenges for the UK economy Can momentum be sustained? Can banks provide enough credit? Paying off the debt: Household Paying off the debt: Government
Banks’ balance sheets are still under great pressure Source: IMF • The IMF estimates that total write-downs over the 2007-2010 will be around £2.8billion • Despite around $1.1 billion of capital injections there is still a hole in balance sheets that needs filling.
Banks are weaning themselves off of relying on wholesale markets Source: Bank of England, National Australia Bank • Bank of England data on household and non-financial corporation deposit holdings and lending, including lending to individuals shows the widening gap that has until recently been reliant upon wholesale funding. This has grown from GBP150bn in 1996 to a peak of £769 billion in October 2008. • Even now the gap is around £700 billion, its smallest level since September 2007. • Money market paralysis has rendered this borrowing impossible – hence the credit crunch
Bank lending appetite is still depressed... • The BoE credit conditions survey shows that banks are restricting credit to UK households. • Real estate lending is now contracting further, with standards tightening again.
Challenges for the UK economy Can momentum be sustained? Can banks provide enough credit? Paying off the debt: Household Paying off the debt: Government
UK economy over-reliant on consumption • Consumption accounts for some 70% of UK GDP, with around 60% of that from retail sales • This fact leaves the UK particularly vulnerable in the current downturn with the credit creation process in decline and asset prices slumping.
And houses are no longer ATM machines Source: Bank of England • After a decade of withdrawals, home owners injected £34 billion of equity into the housing market in the last 18 months. • That represents around 3.0% fall in disposable income, reducing the ability to consume further.
The labour market will also weigh on spending Source: Reuters Ecowin Source: Reuters Ecowin • The numbers claiming unemployment benefit fell by 6,300 in November. That is the first fall in 21 months, though at this stage further rises in unemployment look likely. • At 7.9% the ILO measure already shows the highest unemployment rate since November 1996 and we expect it to rise further in 2010.
But volumes are not the only problem Source: Office for National Statistics • The increase in UK unemployment comes against a background of shorter working hours, which will also weigh on aggregate income. • The fall in full-time hours worked reflects the introduction of 4-day working weeks.
Challenges for the UK economy Can momentum be sustained? Can banks provide enough credit? Paying off the debt: Household Paying off the debt: Government
Public sector debt expected to peak just short of 80% of GDP • We still think that the government remains optimistic on borrowing.
The final level of net debt in UK will not be too far ahead of other G7 nations, but the speed of deterioration is a worry
UK Policy tightening starts in earnest from 2011 • Households bear the brunt of this adjustment through higher NICs. • Businesses also suffer from higher employer contributions. • Despite the rhetoric, tax avoidance measures are an increasingly smaller amount of revenue.
Where to cut? Health 119bn Welfare and Pensions 189bn Defence 38bn Law and Order 35bn Transport 23bn Education 88bn Others 122bn Debt Interest 28bn Housing/Environment 29bn
2009-10 2010-11 2011-12 Change Savings rate by 1p 80 120 160 Change basic rate by 1p 4,100 4,900 5,000 Change higher rate by 1p 880 1450 1400 Change personal allowance by £100 530 650 620 Change all personal allowances by 1% 360 430 410 Change all personal allowances by 10% 3550 4250 4300 Change basic rate limit by 1% 160 280 270 Change basic rate limit by 10% 1,500 2,500 2,450 Change all main allowances by 1% 540 720 680 Change all main allowances by 10% 5,100 6,850 6,750 Change family element of CTC by £100 550 560 570 Change child element of CTC by £100 740 750 750 Source: HM Treasury PBR Nov 2008 Where to tax?
Where to tax? 2009-10 2010-11 2011-12 Change small company Corporation Tax 1% 15 450 650 Change main rate of Corporation Tax 1% 600 1,000 1,150 Change inheritance tax rate by 1% 20 45 45 Change inheritance tax threshold by £5,000 15 30 30 Change main employee rate of NI by 1% 3,900 4,100 4,300 Change additional rate of NI by 1% 950 1,000 1,100 Change employer rate by 1% 4,950 5,200 5,500 Change NI employee threshold by £2/w 245 245 255 Change NI employer threshold by £2/w 290 295 305 Source: HM Treasury PBR Nov 2008
Where to tax? 2009-10 2010-11 2011-12 Beer and Cider Duty (36p) 35 40 40 Wine Duty (£1.46) 25 25 25 Spirits Duty (£5.98) 5 5 5 Tobacco Duty (£3.49) 10 10 10 Petrol per litre (50.35p) 120 110 110 Diesel per litre (50.35p) 150 150 160 Vehicle Excise Duty £120 60 65 65 Change reduced rate of VAT 250 260 270 Change higher rate of VAT 4,600 4,800 5,000 Change Insurance Premium tax 355 485 505 Change 1pc stamp duty band 530 920 1,140 Change 3pc stamp duty band 300 540 780 Change 4pc stamp duty band 710 930 1,170 Source: HM Treasury PBR Nov 2008
UK policy rates have fallen to historic lows • At 0.5%, Bank Rate is at its lowest level since the Bank of England was formed in 1694.
and the BoE has been printing money Source: Bank of England and National Australia Bank estimates • And that is not all that the MPC have done. • ‘Quantitative Easing’ sees them purchasing government and corporate bonds, crediting the reserve accounts of banks. • The hope is that these reserves slowly bleed into the real economy, boosting lending, asset prices, and enabling companies to raise debt. So far, the gap between the implied path and reserves is £66.9bn.
Both these measures have pulled interest rates lower Source: Bank of England • Especially short-term rates over the past year. • But BoE gilt purchases have pulled rates lower across the yield curve.
What influences interest rates? • The level of interest rates reflects several factors: • Short-dated yields (below 3 years) are generally determined by interest rate expectations. • Medium-dated yields (3-10 years) are driven by the economic cycle. • Longer-dated yields are driven by inflation expectations. • Other factors include the MPC’s current QE policy, but also perceptions of the UK government’s ability to pay (Sovereign credit risk).
Financial markets are now beginning to price in BoE tightening • Although over the year as a whole, we have seen the timing of the first rate increase progressively pushed back.
Stock markets point to higher rates • To the degree to which equity markets reflect view of the economic cycle, you could argue that 3-year yields have lagged the improvement in economic prospects (due to QE). • So a sharp rise in shorter dated yields is extremely possible.
That might reflect the increase in sovereign credit risk in the UK • There seems to be some relationship between the slope of the curve and government borrowing. • If so, then the PBR forecasts suggest that the curve could remain much steeper than markets would anticipate.
Due in part to inflationary fears re-emerging • 10-year breakeven rates show the level of inflation expected on average over a 10-year constant horizon. • After a sharp fall in expectations in 2009, the emerging recovery trend and fears about government debt issuance has seen inflation expectations edge higher. • Only in the eurozone does the ECB’s hawkishness see expectations remain broadly unchanged.
Long-dated gilts will also come under pressure • Long-dated gilts comprise 35.1% of the total debt stock, making them the largest component in the government’s portfolio.
Markets are getting nervous about a sovereign downgrade 10 year CDS Rates • Although levels are not back to 2009 highs, the gap between UK and Germany is widening as markets fret as to whether the UK will maintain its sovereign rating. • Although Ratings Agencies have confirmed that they are not looking for a downgrade this side of a General Election, the lack of consolidation in the PBR means that a sovereign downgrade is looking more likely.
50% 45% Con 40% 35% Lab 30% 25% 20% Lib 15% Other 10% 5% 0% May Jan Feb Mar Apr May Jun Jul Aug Sep Oct Nov Dec 05 09 Which may intensify as the General Election approaches.UK opinion polls since January 2009 Source: ICM/The Guardian • Conservative lead is narrowing and is now in single digits for first time since December 2008 • Labour support has risen 6 points since the Summer low of 25% • Opinion poll lead, if sustained, points to a Conservative majority around 20 seats or fewer
So longer dated yields will continue to rise Source: Bloomberg • Looking at the UK swap curve, rates in December from 6 years out were already higher than seen in January. • As QE unwinds (as early as February) and the curve climbs higher, we will see higher rates across the board.
Recession spreads • Yorkshire and the Humber was the first region to slip into negative GVA growth in 2008q1. The diversified economy has fared a little better than the North East and North West regions in recent quarters, however. • Manufacturing sectors, ranging from food processing to specially engineering seems to have fared a little better. • But Q3 data suggests that the construction sector continues to struggle. • Although manufacturing exports have received a small lift so far, tourism –focused around North Yorkshire –enjoyed a strong Q3 with annual visitor numbers, total spending and occupancy rates all up. • Financial and Business Services grew until 2008 Q3. Job creation was above the UK average since 2007, but has since fallen back. The region remains vulnerable to any employment shake-out from the merger of UK banks. • Falling government spending will also impact on public sector activity, which has hitherto remained extremely supportive.
Although domestic demand looks better Source: British Chambers of Commerce Source: British Chambers of Commerce • The BCC surveys show that after sharp falls in activity through 2008, sales are now beginning to increase. • Note that manufacturing activity is running well ahead of services and that Yorkshire is also outperforming the UK average.
Key problem seems to be exports Source: British Chambers of Commerce Source: British Chambers of Commerce • Export growth remains a little weaker, especially in manufacturing. • Service sector seems to be doing rather better.
And recent data would support that view Source: HM Revenue and Customs • HMRC data only cover goods trade, but they show a very sharp fall in exports in the first half of the year. • The lack of bounce in Q3 is consistent with BCC data, but we hope that Q4 will be better.
RICS house price survey: a regional breakdown Scotland North Yorkshire & The Humber North West East Midlands West Midlands East of England Wales London South West South East