Download
1 / 39
390 likes | 534 Vues
Did The 1914 Athletics Throw the World Series?. Controversies in Baseball. Steroids. Gambling. The 1919 Black Sox. History. The several of the 1919 White Sox took money from gamblers in exchange for throwing the World Series Afterward, they confessed

E N D
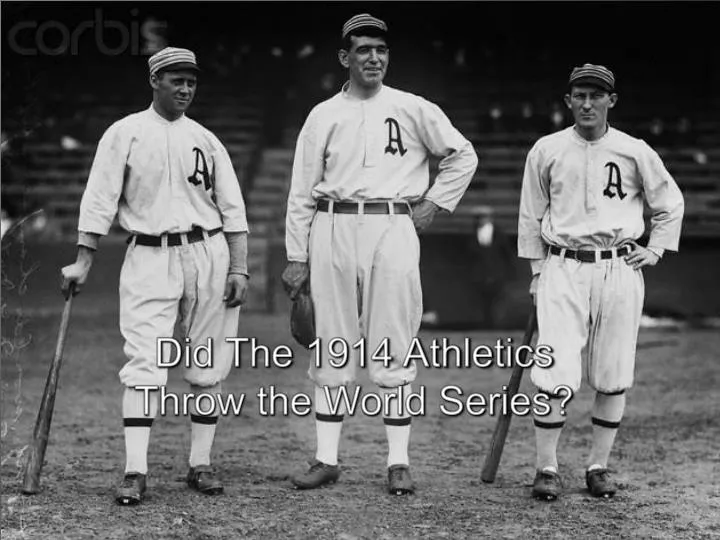
Did The 1914 Athletics Throw the World Series?
History • The several of the 1919 White Sox took money from gamblers in exchange for throwing the World Series • Afterward, they confessed • One of the confessors was “Shoeless” Joe Jackson
History Cont. • He later denied throwing the series • Some postulate he took money but never performed below his ability • The paper by Jay Bennett uses statistical reference to prove he did not purposely lose
That article you had to read? • Jay Bennett’s Did Joe Jackson Throw the 1919 World Series? • Hinges on a newish statistic devised by Bennett and Flueck known as Player Game Percentage (henceforth known as PGP)
A Lil’ More about PGP • Takes into account Δ WP, or the change in win probabilities caused by a player’s performance on a play • For example, Al Weis increased the Mets’ probability of victory from 51.1% to 84.9% by singling in the top of the ninth inning of Game 2 of the 1969 World Series
STILL MORE on PGP • Δ WP = 84.9 – 51.1 = 33.8 • The Mills Brothers multiplied this number by 20 to determine Win Points • Win Points = 676 • Equal number of Loss Points are “awarded” to the defender • PGP = (Win Points – Loss Points)/40
Joe Jackson’s PGP • Cumulative PGP over the course of the series was 1.45 (!) • Higher than most of his team and most of the other team • So it’s pure flummery that Jackson threw the series, right?
Performance in the Clutch? • Traditional Statistics • Performed well in clutch and Late Inning Pressure Situations • Regression Analysis • Plots PGP in terms of Slugging Average • Finds that he had an excellent Slugging Average and a high PGP • Resampling Analysis • A standard sampling Distribution of Batting PGP/Game was created
And for Jackson… • With the mean PGP/Game value for this distribution being 1.56 and the median being 1.59, Jackson’s PGP/Game value of 2.14 puts him in the .686 quantile of the distribution • A hypothesis test at the .10 (or .05) level indicates that we do not reject the null hypothesis and conclude that Joe Jackson batted as well as expected in clutch situations
Application to 1914 World Series • We’ll be using the rationale contained in Bennett’s article to examine whether the Philadelphia Athletics threw the 1914 World Series against the Boston Braves • Although we’re looking primarily at team performance, we’ll also examine individual players’ contributions to their team’s fate
Conclusion of Paper • Jackson was the third most valuable player in the Series for his team • Made a greater contribution to his team’s chances for victory than any other batter in the Series • Positive overall contribution to White Sox victory, while all other Black Sox had negative impacts • High batting stats in clutch situations
Background • The Athletics were heavily favored to win the series based on season performance • They had no history of performing poorly in the clutch • Victories in the 1910, 1911, and 1913 World Series…s
Class Activity • If a player has the following stats, what is his average change in WP?
-The probability of the eventual winner winning the game at the beginning of a certain play -Unfortunately only available for the first two games - Idea came from WP plots in Bennett article Winning Team Win Expectancy Plots
Brave’s BA Ho : BA ≤ BA S Ha : BA > BA S N Mean StDev SE Mean BA 9 0.2664 0.1552 0.0517 BA S 9 0.2561 0.0287 0.0096 Difference 9 0.0103 0.1562 0.0521 95% lower bound for mean difference: -0.0865 T-Test of mean difference = 0 (vs > 0): T-Value = 0.20 P-Value = 0.424
Brave’s OPS Ho : OPS ≤ OPS S Ha : OPS > OPS S N Mean StDev SE Mean OPS 9 0.716 0.513 0.171 OPS S 9 0.680 0.094 0.031 Difference 9 0.036 0.522 0.174 95% lower bound for mean difference: -0.288 T-Test of mean difference = 0 (vs > 0): T-Value = 0.20 P-Value = 0.422
A’s BA Ho : BA ≥ BA S Ha : BA < BA S N Mean StDev SE Mean BA 8 0.1791 0.0892 0.0315 BA S 8 0.2842 0.0413 0.0146 Difference 8 -0.1051 0.1002 0.0354 95% upper bound for mean difference: -0.0380 T-Test of mean difference = 0 (vs < 0): T-Value = -2.97 P-Value = 0.010
A’s OPS Ho : OPS ≥ OPS S Ha : OPS < OPS S N Mean StDev SE Mean OPS 8 0.519 0.284 0.100 OPS S 8 0.735 0.097 0.034 Difference 8 -0.2158 0.2789 0.0986 95% upper bound for mean difference: -0.0289 T-Test of mean difference = 0 (vs < 0): T-Value = -2.19 P-Value = 0.032
Brave’s WHIP Ho : WHIP≥ WHIP S Ha : WHIP < WHIP S N Mean StDev SE Mean WHIP 3 0.905 0.187 0.108 WHIP S 3 1.154 0.123 0.071 Difference 3 -0.2483 0.1436 0.0829 95% upper bound for mean difference: -0.0062 T-Test of mean difference = 0 (vs < 0): T-Value = -2.99 P-Value = 0.048
Brave’s SO/IP Ho : SO/IP ≤ SO/IP S Ha : SO/IP > SO/IP S N Mean StDev SE Mean SO W 3 0.684 0.246 0.142 SO S 3 0.466 0.053 0.031 Difference 3 0.218 0.292 0.169 95% lower bound for mean difference: -0.274 T-Test of mean difference = 0 (vs > 0): T-Value = 1.29 P-Value = 0.163
A’s SO/IP Ho : SO/IP ≥ SO/IP S Ha : SO/IP < SO/IP S N Mean StDev SE Mean SO W 4 0.405 0.299 0.149 SO S 4 0.524 0.104 0.052 Difference 4 -0.1195 0.1971 0.0986 95% upper bound for mean difference: 0.1124 T-Test of mean difference = 0 (vs < 0): T-Value = -1.21 P-Value = 0.156
A’s WHIP Ho : WHIP ≥ WHIP S Ha : WHIP < WHIP S N Mean StDev SE Mean WHIP 4 1.370 0.337 0.169 WHIP S 4 1.232 0.048 0.024 Difference 4 0.138 0.365 0.183 95% lower bound for mean difference: -0.291 T-Test of mean difference = 0 (vs > 0): T-Value = 0.76 P-Value = 0.252
So Using The Paper as a Reference • Did the Athletics Throw the Series?
L. Mann H. Gowdy F. Baker E. Murphy B. James
Conclusions • Overwhelming evidence indicates that the Athletics did indeed perform worse in the World Series • But we can’t be entirely sure… • Thoughts? • SAY IT ON THE HOMEWORK
And Greatest Names… P Stuffy McInnis Rabbit Maranville PossomWhitted