Download

1 / 28
280 likes | 439 Vues
VELOCITY-TIME GRAPHS. Site of airplane crash. Crash site of flight 93. Typical plane crash v-t graph. Velocity- time set up. The vertical axis is measured in m/s Positive number represent forward motion Negative numbers represent backward motion The horizontal axis is measured in s.

E N D
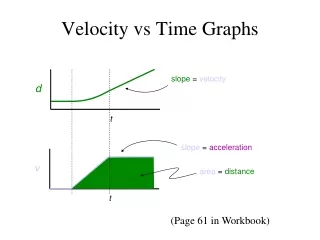
Velocity- time set up • The vertical axis is measured in m/s • Positive number represent forward motion • Negative numbers represent backward motion • The horizontal axis is measured in s
Horizontal lines on a V-T graph Velocity (m/s) Time (s)
Determine direction on V-T graph Any portion of graph above the zero line denotes forward motion Any graph on line, means object at rest
Tilted lines on V-T graphs V (m/s) T (m/s)
Tilted lines on V-T graphs V (m/s) T (m/s)
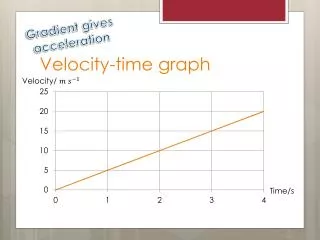
What do tilted lines mean on a V-T graph? The object is changing its velocity Acceleration How it accelerates is determined by Location of graph (Above, Below x-axis) Type of tilt
Acceleration is… A change in the velocity of the object Tilted lines on a V-T graph indicate acceleration Acceleration can be calculated by finding the slope value of these lines
What kind of motion is indicated on this graph? V (m/s) T (s)
Constant Velocity or Acceleration? Horizontal lines represent CV Slanted lines represent ACC
Faster or slower? Tilt towards zero line = slower Tilt away from zero line = faster
What would curves mean on a V-T graph Curves would indicate non-constant acceleration Think roller coaster rides, when you get pushed against the harness or back into the seat The ‘Jerk’
Identify motion for each part of the V-T graph V (m/s) T (m/s)
Create a V-t graph that… Section 1: Shows constant motion of (-3) m/s for 5 seconds. Section 2: Shows constant acceleration (slowing down in the negative direction) Section 3: Shows no movement for 5 seconds Section 4: Shows constant acceleration (speeding up in the positive direction)
Can there be a vertical line in a graph of a real object’s motion?
No That would mean that the object is at several places at an instant of time
Differences between V-t graphs and P-T graphs The vertical #’s tell how fast, not location V-t does not indicate start position Direction is indicated by position on graph, not slope Acceleration is indicated differently on each type of graph
On V-T graph, what is the area equal to? 5 m/s 10 s
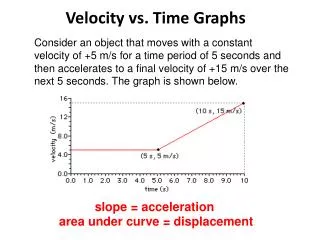
How do you find the overall Displacement, Distance from a V-t graph? How far does an object travel if it moves at 5 m/s for 10 seconds? V = d / t d = t x V 5 x 10 = 50 m
Finding overall displacement from V-T graph How far does an object travel if it goes 3 m/s for 10 seconds? V 3 t 10
To find displacement To find displacement of any section Find the area under the graph Any section that is above the x-axis is positive displacement Any section below the x-axis is negative displacement Combine displacements for overall velocity