Download
1 / 24
310 likes | 643 Vues
Position-Time and Velocity-Time Graphs. Questions for Consideration. What is a position-time graph? What is a velocity-time graph? How do features on one graph translate into features on the other?. Position-Time Graphs. Show an object’s position as a function of time. x-axis: time

E N D
Questions for Consideration • What is a position-time graph? • What is a velocity-time graph? • How do features on one graph translate into features on the other?
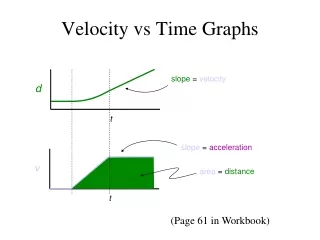
Position-Time Graphs • Show an object’s position as a function of time. • x-axis: time • y-axis: position • Slope = average velocity
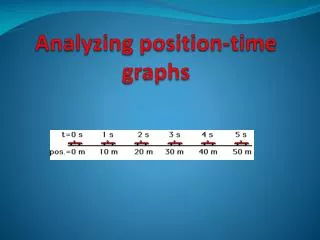
Position-Time Graphs • Imagine a ball rolling along a table, illuminated by a strobe light every second. • You can plot the ball’s position as a function of time. 0 s 1 s 2 s 3 s 4 s 5 s 6 s 7 s 8 s 9 s 10 s
10 9 8 7 6 5 4 3 2 1 1 2 3 4 5 6 7 9 10 8 Position-Time Graphs position (cm) time (s)
10 9 8 7 6 5 position (cm) 4 3 2 1 time (s) 1 2 3 4 5 6 7 9 10 8 Position-Time Graphs • What are the characteristics of this graph? • Straight line, upward slope • What kind of motion created this graph? • Constant velocity
Position-Time Graphs • Each type of motion has a characteristic shape on a P-T graph. • Zero speed (at rest) • Constant velocity • Accelerating
time (s) time (s) pos. (m) pos. (m) Constant speed in positive direction. Constant speed in negative direction. Position-Time Graphs • Constant velocity is represented by a straight segment on the P-T graph.
time (s) pos. (m) A horizontal segment means the object is at rest. Position-Time Graphs • An object not moving is represented by a straight segment on the P-T graph.
time (s) time (s) pos. (m) pos. (m) Speeding up in positive direction. Speeding up in negative direction. Position-Time Graphs • Curved segments on the P-T graph mean the object’s speed is changing.
50 change in y slope = 40 change in x 30 position (m) (30 m – 10 m) 20 slope = (30 s – 0 s) 10 (20 m) 10 20 30 40 slope = (30 s) time (s) Position-Time Graphs • The slope of a P-T graph is equal to the object’s velocity in that segment. slope = 0.67 m/s
N position (m) time (s) S Position-Time Graphs • The following P-T graph corresponds to an object moving back and forth along a straight path. Can you describe its movement based on the graph?
5.2 Velocity vs. Time • X-axis is the “time” • Y-axis is the “velocity” • Slope of the line = average acceleration
Velocity-Time Graphs • A velocity-time (V-T) graph shows an object’s velocity as a function of time. • A horizontal line = constant velocity. • A straight sloped line = constant acceleration. • Acceleration = change in velocity over time. • Positive slope = positive acceleration. • Negative slope = negative acceleration. • Not necessarily slowing down!
N velocity (m/s) time (s) S Velocity-Time Graphs • A horizontal line on the V-T graph means constant velocity. Object is moving at a constant velocity North.
N velocity (m/s) time (s) S Velocity-Time Graphs • A horizontal line on the V-T graph means constant velocity. Object is moving at a constant velocity South.
N velocity (m/s) time (s) S Velocity-Time Graphs • If an object isn’t moving, its velocity is zero. Object is at rest
Velocity vs. Time • Horizontal lines = constant velocity • Sloped line = changing velocity • Steeper = greater change in velocity per second
Velocity-Time Graphs • If the V-T line has a positive slope, the object is undergoing acceleration in positive direction.
N velocity (m/s) time (s) Positive velocity and constant positive acceleration S Velocity-Time Graphs • V-T graph has positive slope.
Slope of V vs. T graph Slope = rise/run Pick two points on the line: (0,0) (2,2) Slope = (2-0)/(2-0) = 1.0 m/s2 Slope = Average acceleration of the object
Velocity-Time Graphs • If the V-T line has a negative slope, the object is undergoing acceleration in the negative direction.
N N velocity (m/s) velocity (m/s) time (s) time (s) Negative velocity and negative acceleration: object is speeding up! (in negative direction) Positive velocity and negative acceleration: object is slowing down, S S Velocity-Time Graphs • V-T graph has negative slope.