Download
1 / 68
800 likes | 1.16k Vues
Position-Time graphs. WHY GRAPH?. What is the best way to describe motion of an object to somebody that did not witness it?. With accuracy Can be understood by everybody in the world. Describe my motion. Write a description of my motion on a piece of paper. A better way.

E N D
What is the best way to describe motion of an object to somebody that did not witness it? With accuracy Can be understood by everybody in the world
Describe my motion Write a description of my motion on a piece of paper
A better way Represent the motion in the universal language: Math Draw a graph
Reasons Universal language Convey more information visually Less time to draw than write
Axis What do the numbers mean
Direction Is direction of motion indicated on the graph?
Position-time graphs Position value is recorded as the vertical (y) component Time value is recorded as the horizontal The point (4,-8) means you are at -8 units from the central reference point at the 4 second mark
Position-time graph Where is the object at the 3 second mark? 9 second mark?
What information does the graph tell you about motion Shape of the line Straight-vs-curved Tilt of the line Flat-vs-slanted Tilted upward-vs-tilted downward Vertical lines Placement of the line Start position Postive-vs negative territory
Position Time graphs Graph indicates Positive motion Constant velocity Between fast and slow rate of motion
At rest How does a graph indicate that the object does not move
Which line shows no motion?Which line shows fastest rate of motion?
Graph indicates Non-constant velocity Positive motion Getting faster
Graph indicates Negative motion Non-constant velocity Getting faster
Graph indicates Negative motion Non-constant velocity Slowing down
Forward, backward, or stopped If the graph is horizontal, then no motion has occurred. The position (vertical) value did not change over time If the final position is more positive than the initial position , it moved forward If the final position is less positive than initial position, it moved backward
Is the object moving at a constant rate? Constant velocity means the rate of motion does not change over time Graphs show constant velocity by creating a straight line. Angle (tilt) of line does not matter
How fast is it going? Constant velocity can occur in any direction Being stopped gives you a constant velocity of zero (0). The tilt of a straight line will indicate forward, or backward motion Slope of the line is a measure of the object’s velocity The amount of tilt will indicate how fast th object goes
What if it is not a straight line? Then the velocity is not constant If the velocity changes over time the car accelerates Any change in velocity indicates acceleration On a P-T graph, acceleration is indicated by a curved line
It is getting faster or slower? Tangent lines Pick 2 point along section of graph Draw tangent lines If the slope of line increases, then object is getting faster Divide section up into equal 2 blocks of time. Compare the displacement in each If amount of displacement increases, it is getting faster
Tangent line Line that touches a graph at only one point
Mathematical method to determine slope of tangent lines Determine the rate of change Derivatives in calculus
Draw the graph Draw a graph that would represent the following motion: Positive Motion Non-Constant Velocity Slowing Down
Information from graphs For each section with the same type of motion, you should be able to determine: Is the object moving forward, backward, or stopped Is the motion constant or not? If constant, is the rate of motion fast or slow? If not constant, is the object getting faster or slower?
Position-Time 4 2 5 3 6 1 2
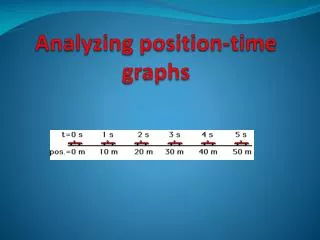
Position time graph Each point on the graph indicates the position of the object at a certain time Shows both distance and displacement Y-axis indicates position X-axis indicates time
Most graphs are made from a combination of different types of motions
What you should be able to tell me about the graph Whether object is moving or not Which direction it moves Whether motion is constant or not Whether object speeds up or slows
Creating a graph from written information Draw a copy on a piece of paper
In the next graph… You will create a graph that represents the following motion Section 1- starts at the -2 meter position and moves with slow positive constant velocity Section 2- moves with fast negative constant velocity
Information for next graph… Section 3- moves with positive non-constant velocity and is getting faster Section 4- moves with a constant velocity of zero Section 5 – moves with a negative non-constant velocity and is slowing down
Example #1 Starting from a position of (-3). Object speeds up, moving forward to the origin Object maintains constant velocity moving forward, reaches (4) Object slows down, moving forward, reaches (6) Object Stops for several seconds Object speeds up moving backwards